 Block
BlockFrom the record
1 National Register listing published here, 1 of them a National Historic Landmark.
Sources: the National Register database, National Park Service
39 topographic sheets cover 8 settlements here, and 1 property is on the National Register of Historic Places.
1 National Register listing published here, 1 of them a National Historic Landmark.
Sources: the National Register database, National Park Service
Every property in this county listed on the National Register of Historic Places, with the year it was listed and the federal nomination document.
| Photograph | Property | Type | Listed | Reference |
|---|---|---|---|---|
 | King Ranch | district | 1966 | 66000820 |
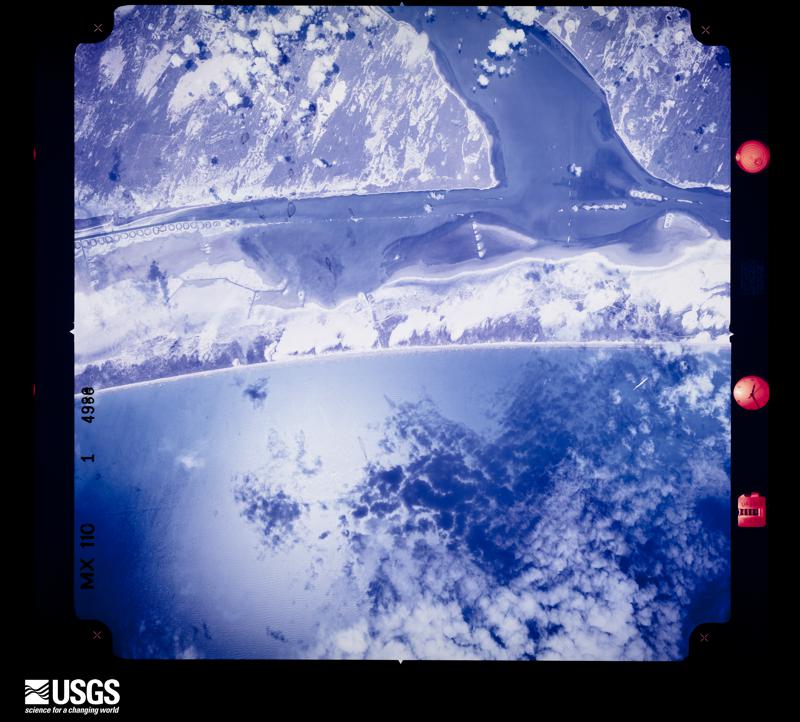
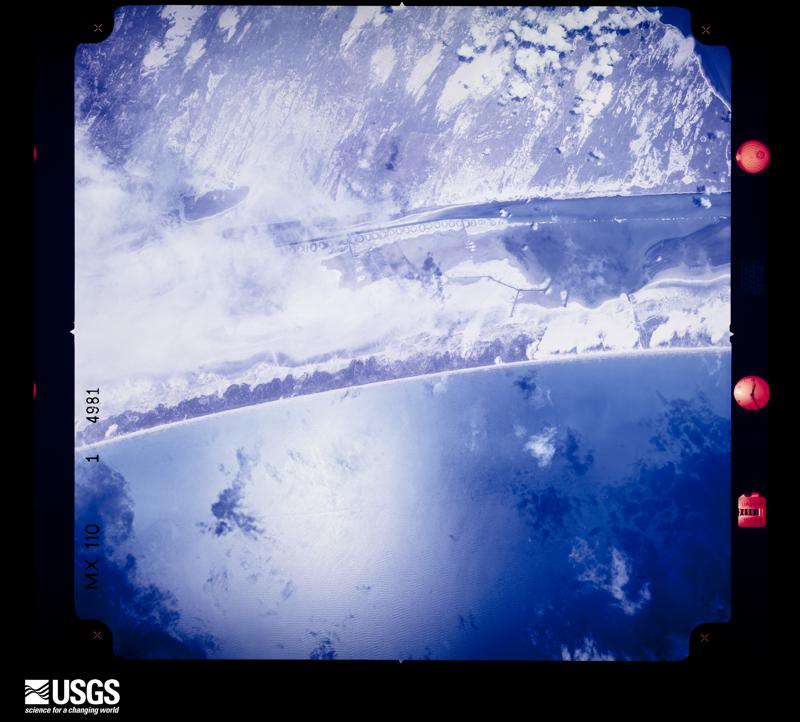
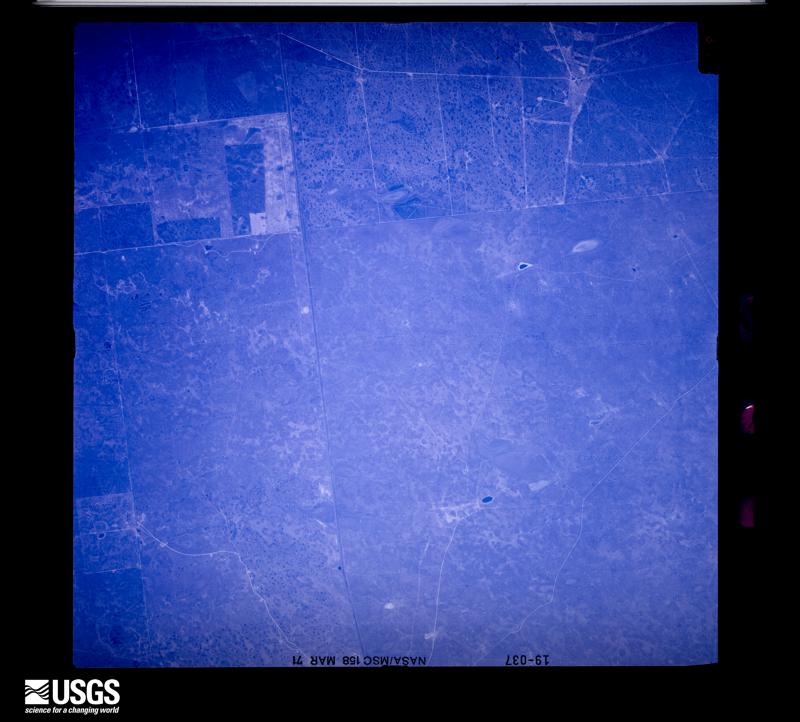
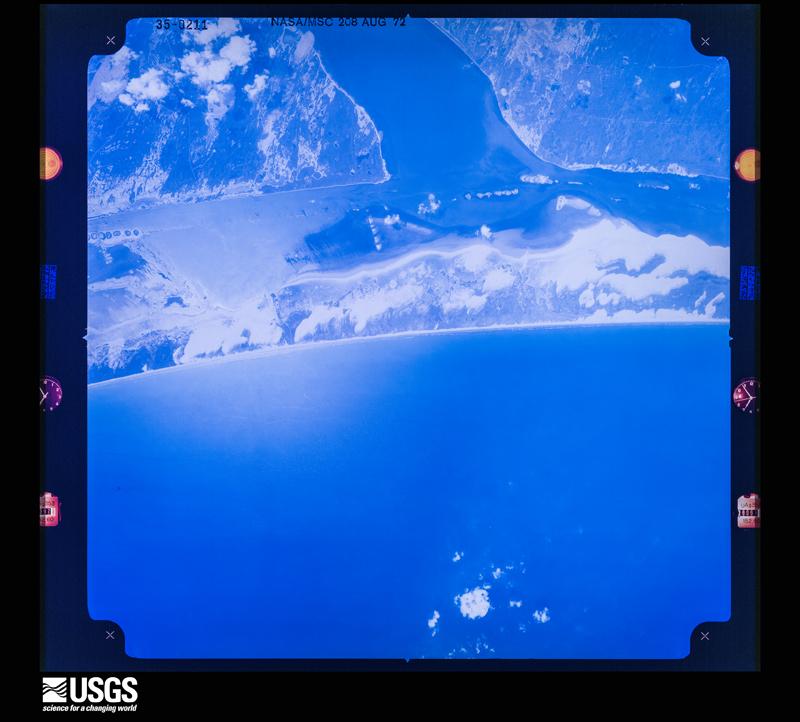
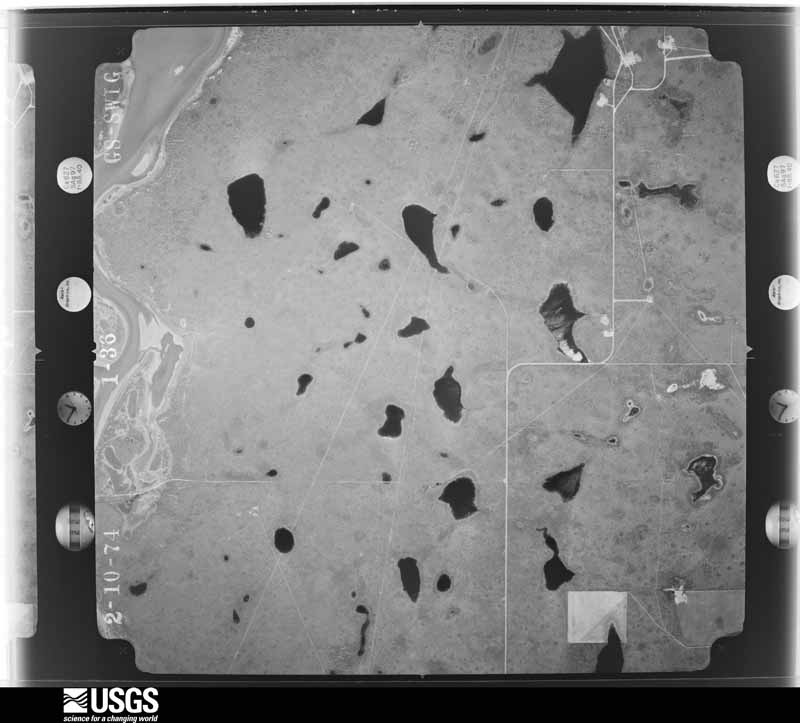
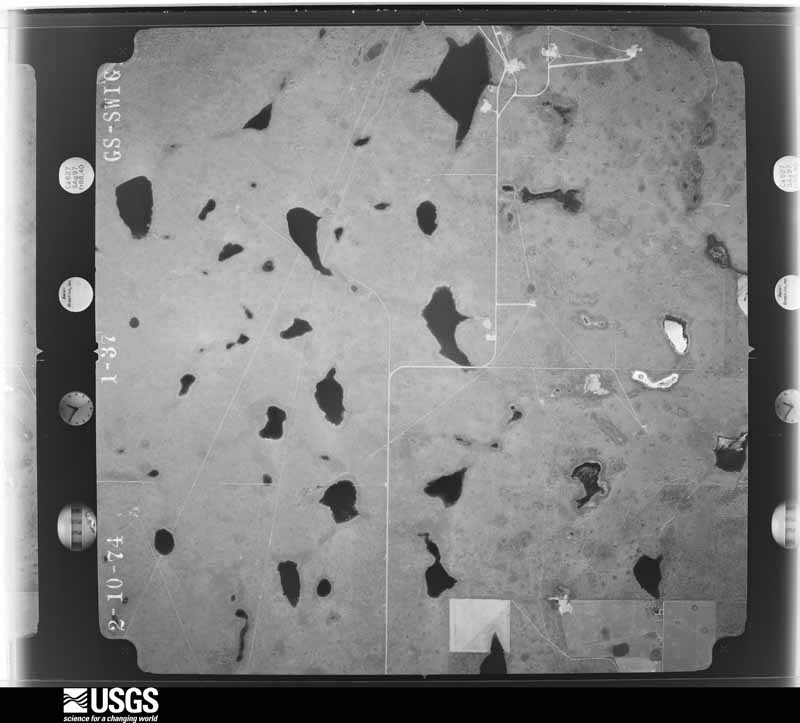
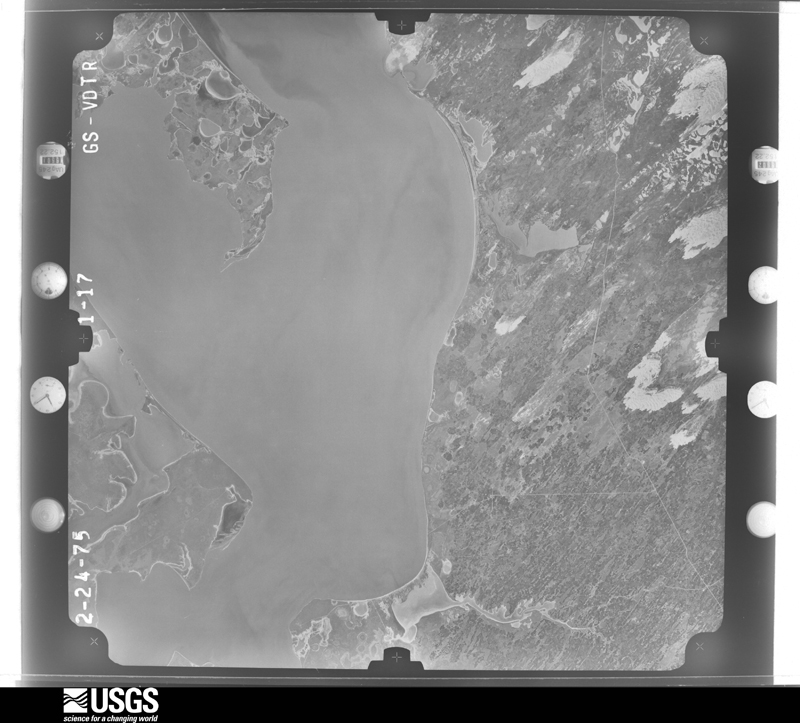
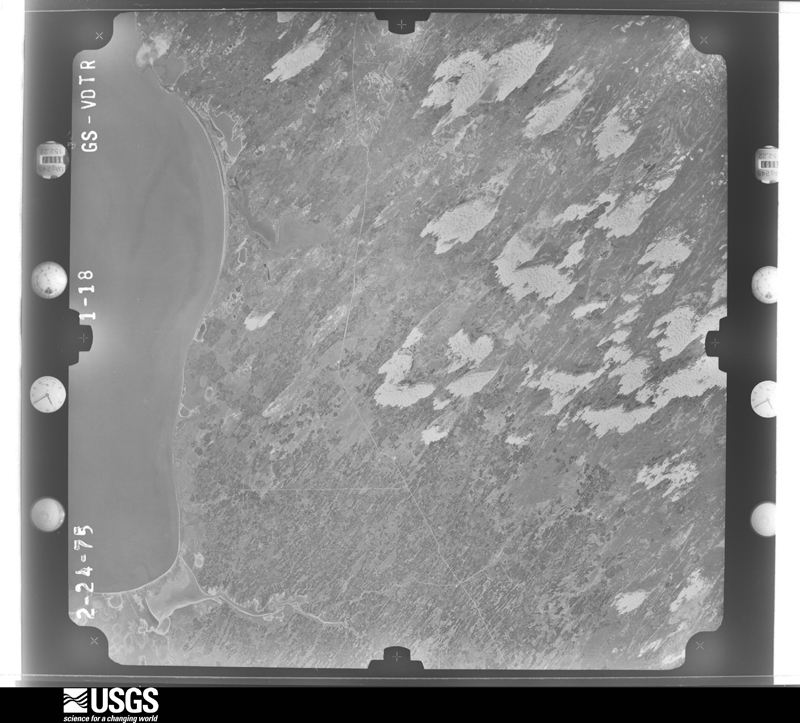
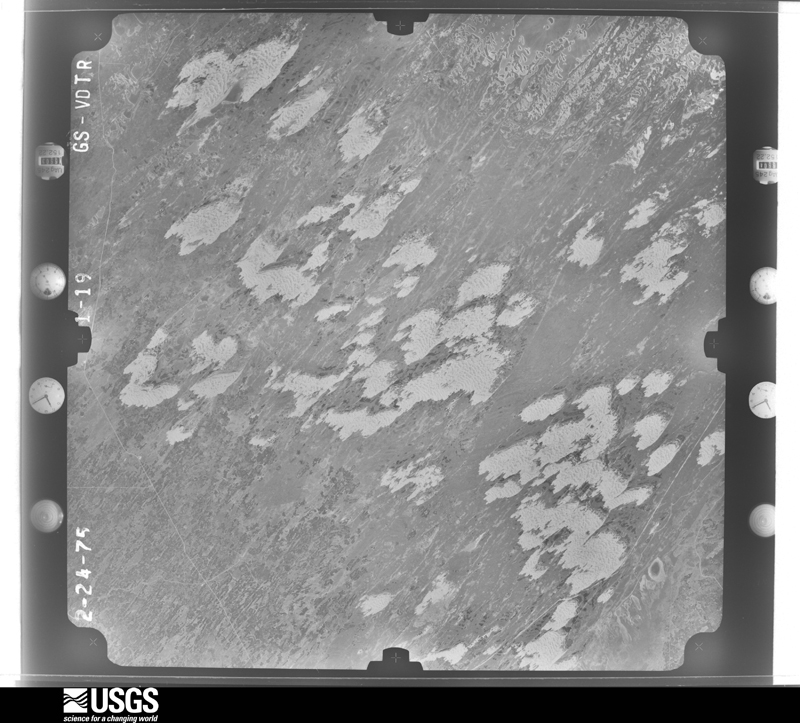
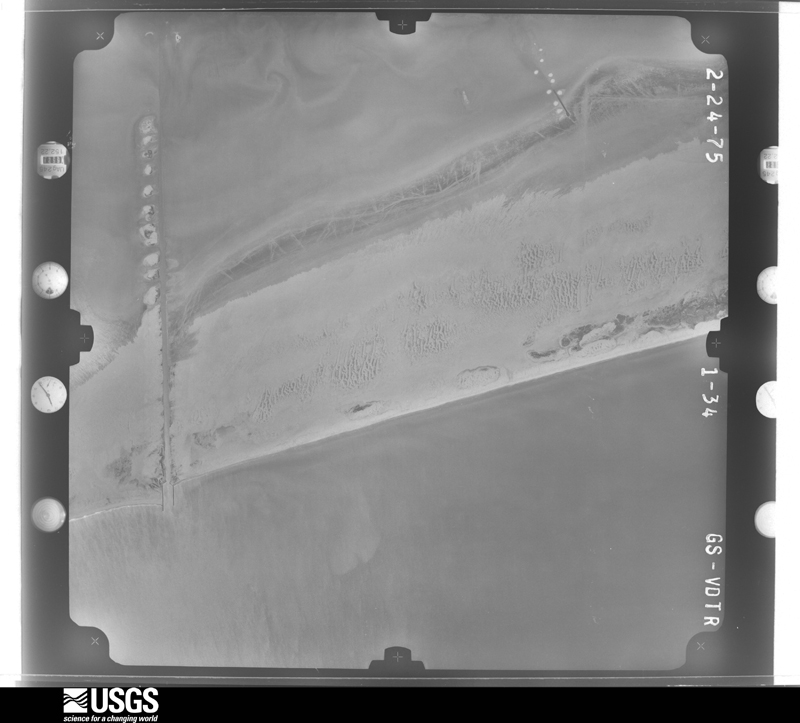
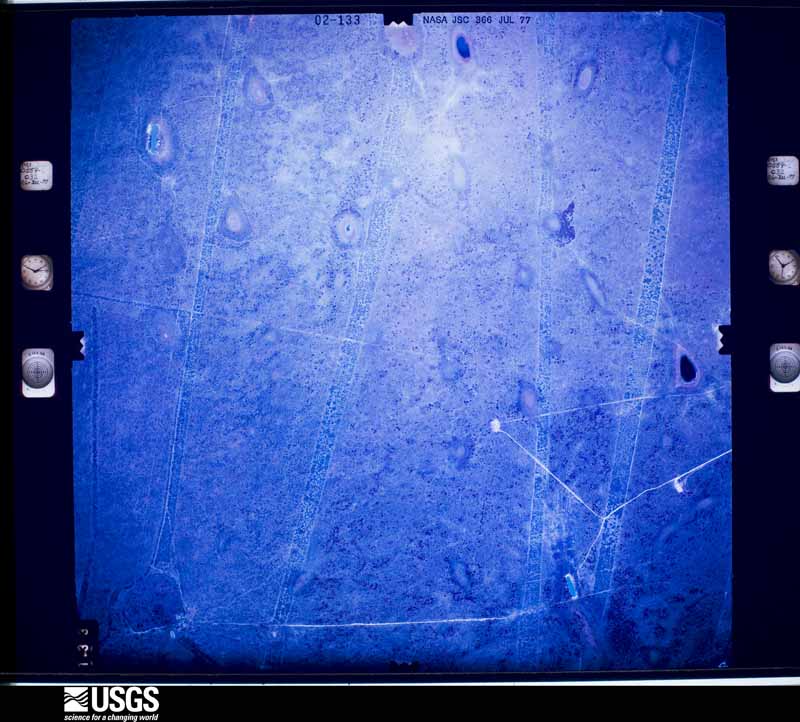
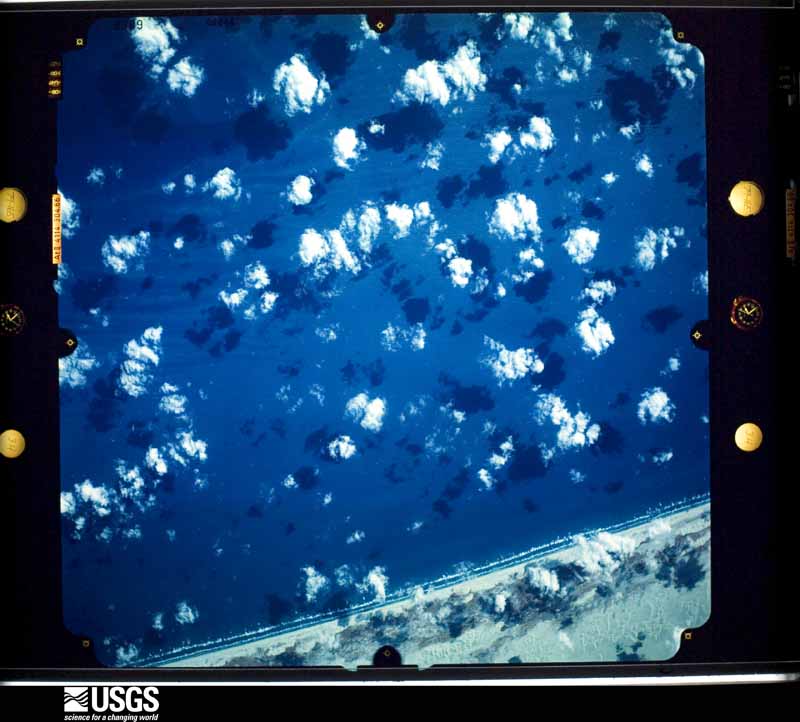
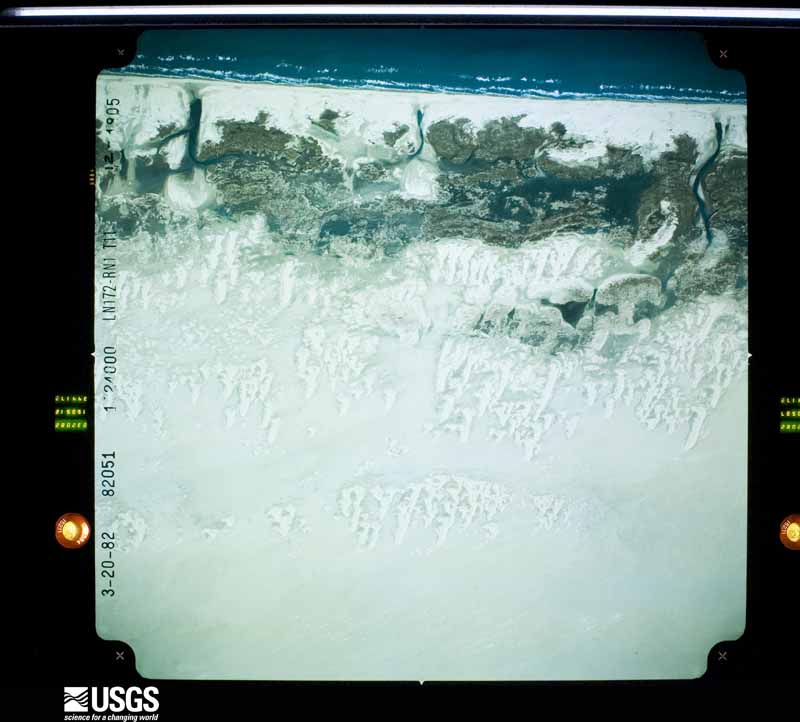
Flown by the U.S. Geological Survey between 1937 and 1989, the Aerial Photo Single Frames collection is the definitive mid-century view of the land: fields, roads and rivers as the camera saw them. The Survey holds 1,687 frames inside the rectangle that bounds this county; the 48 frames below were taken over the county itself, chosen across the decades of flights (at most four a year from that rectangle), so one flight cannot crowd out the rest. The full set is free to browse and download at EarthExplorer under the dataset Aerial Photo Single Frames.
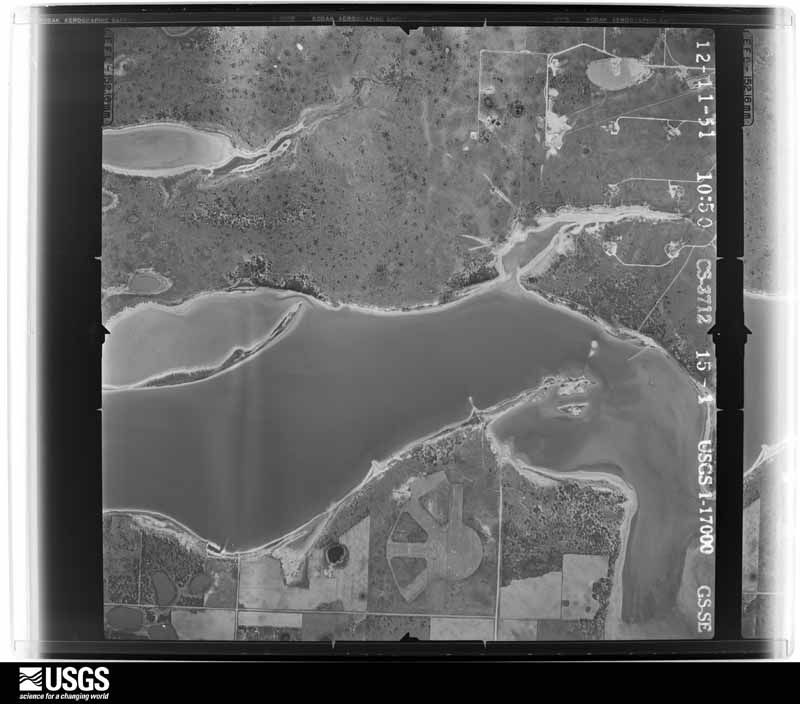
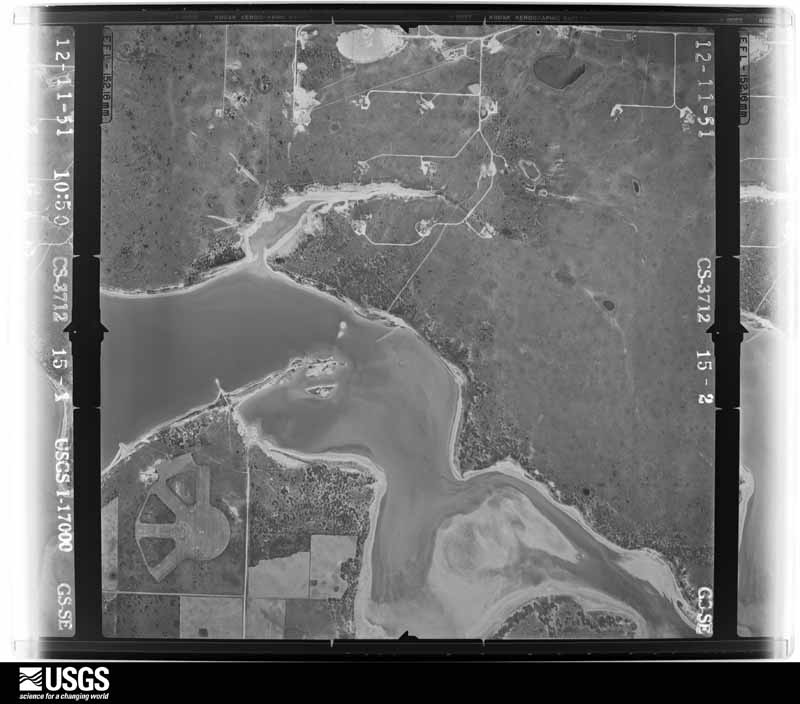
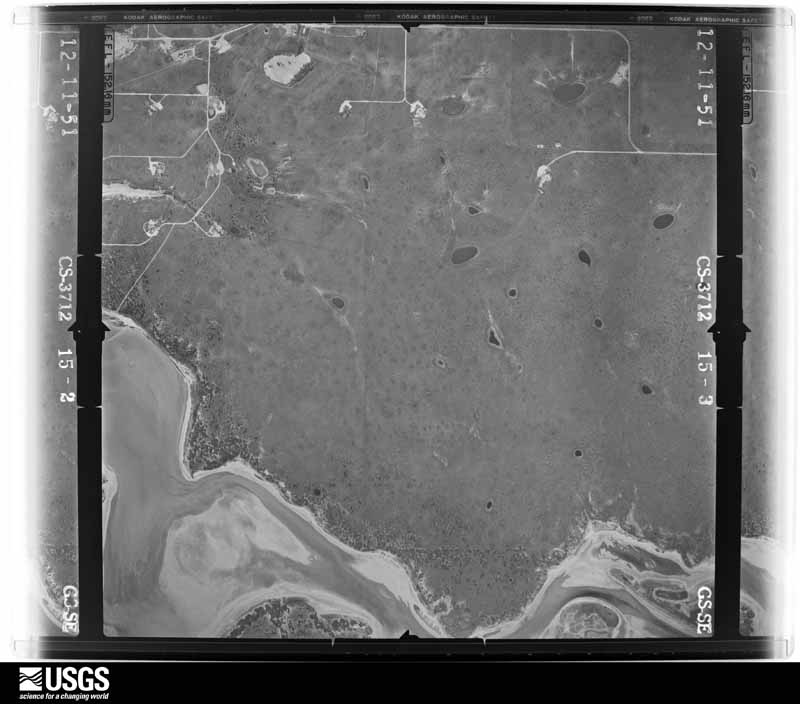
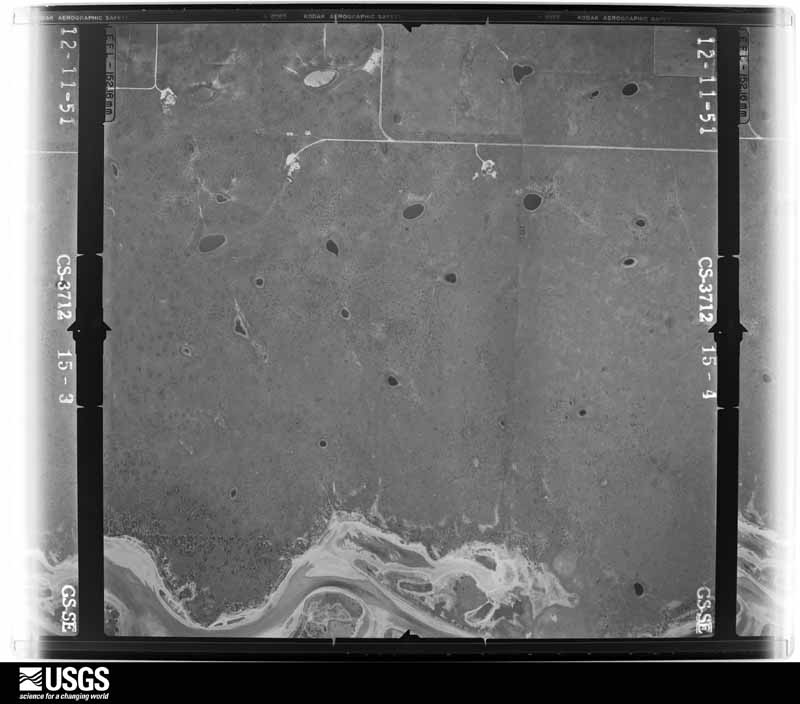
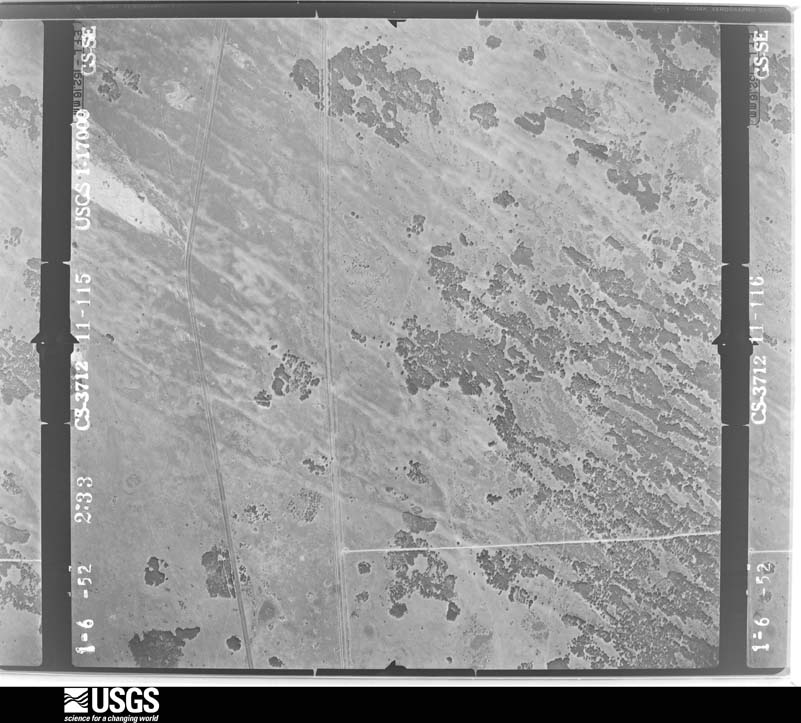
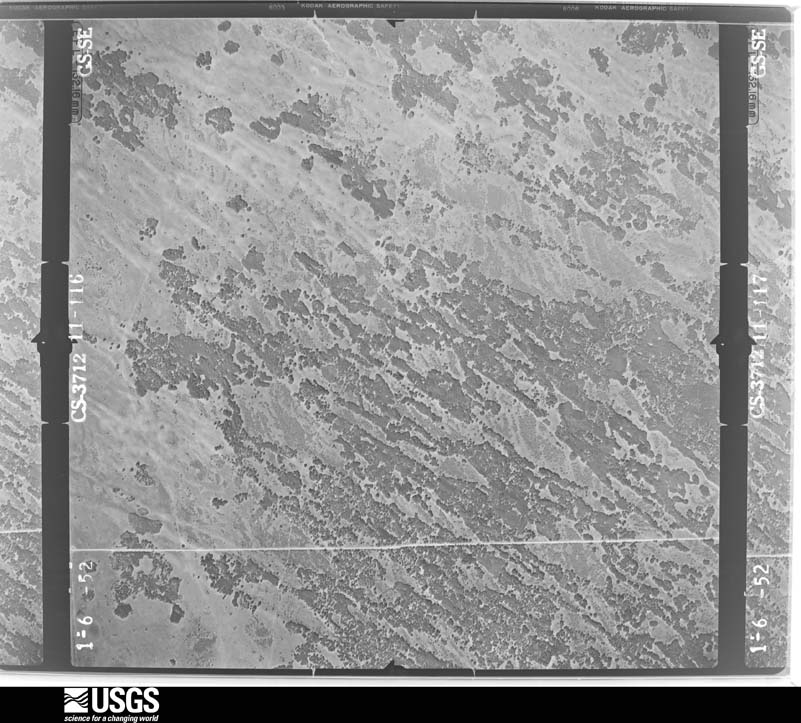
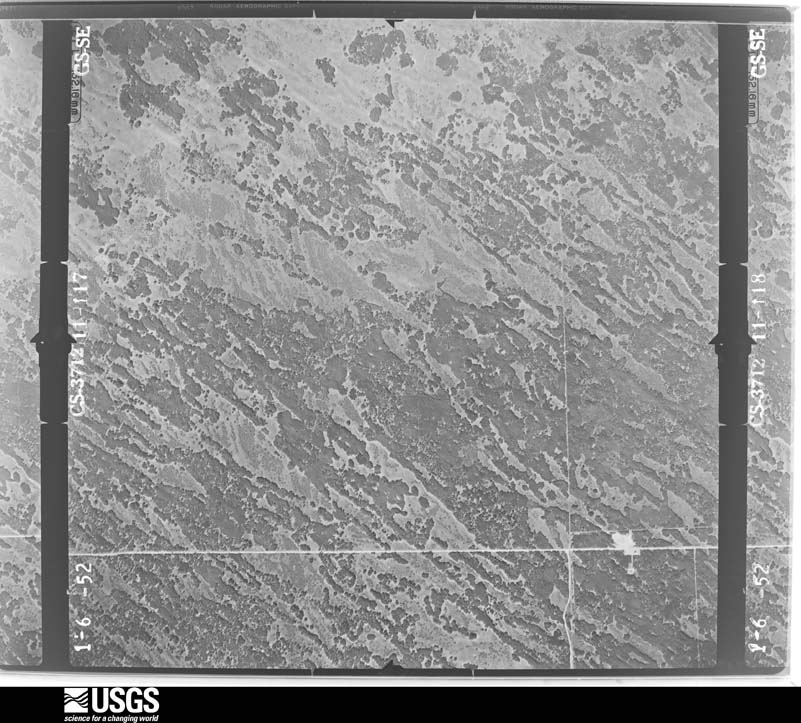
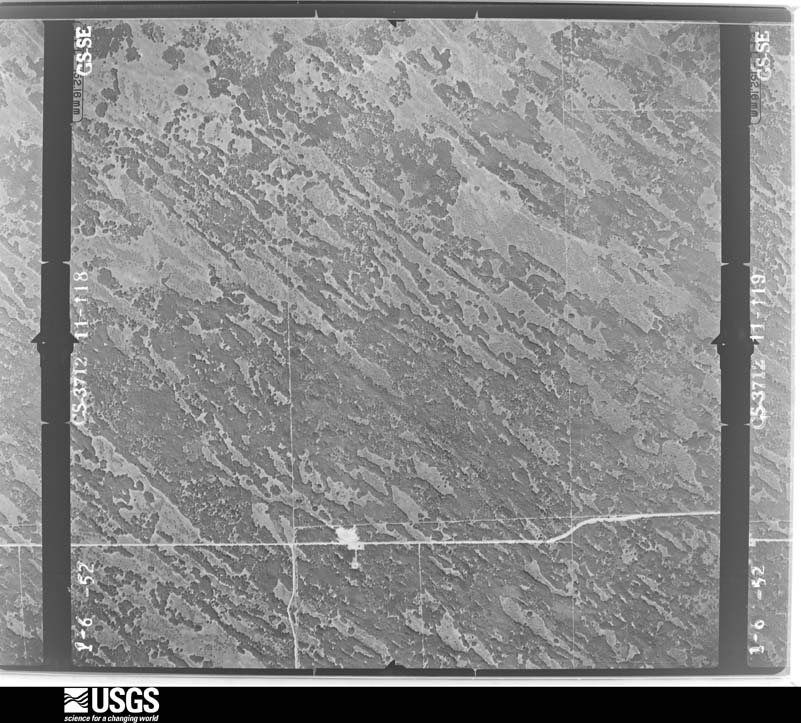
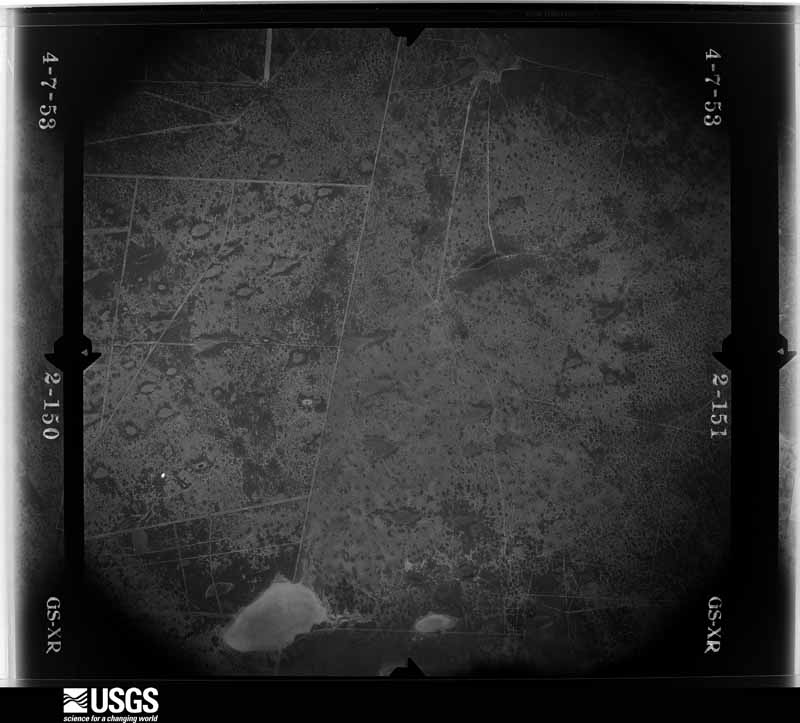
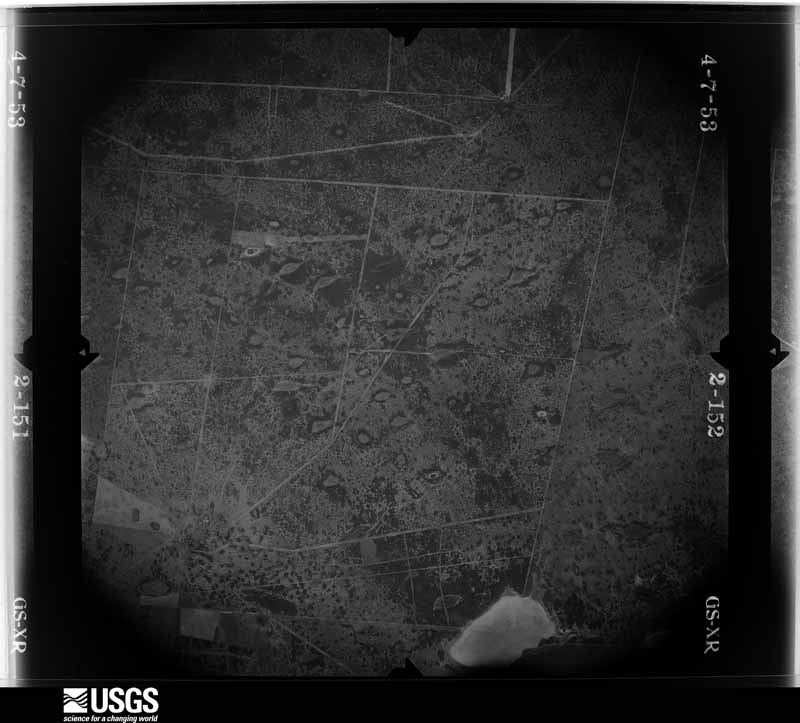
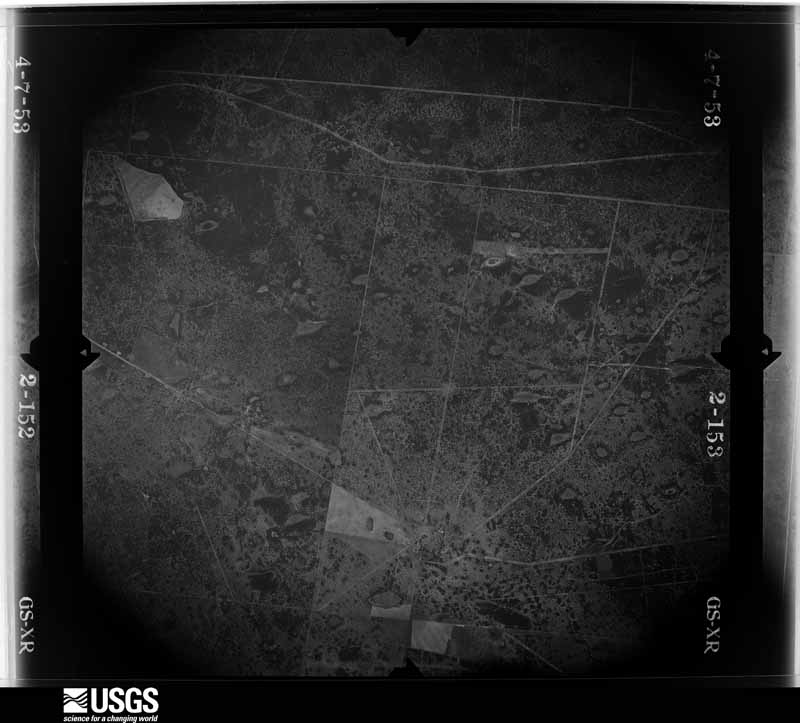
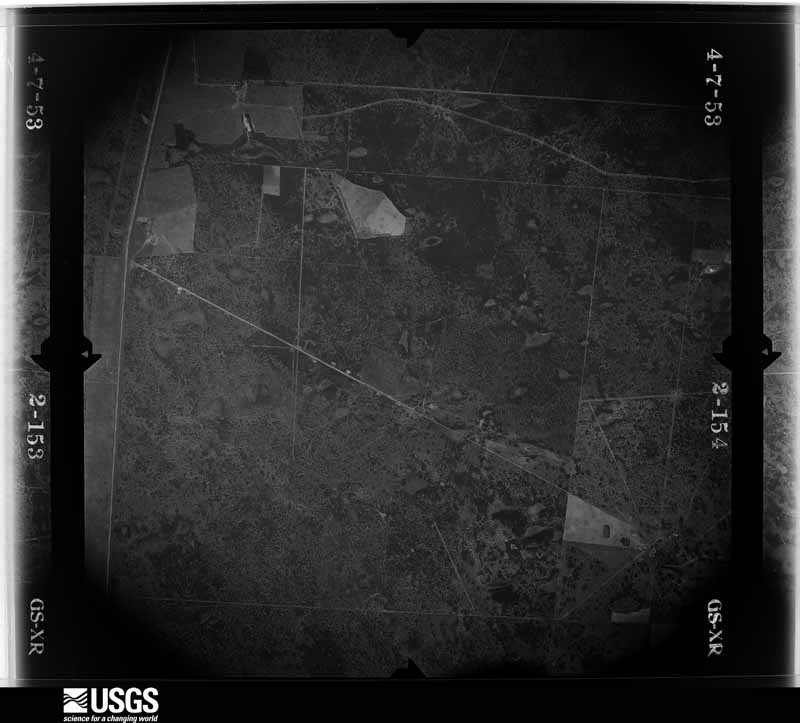
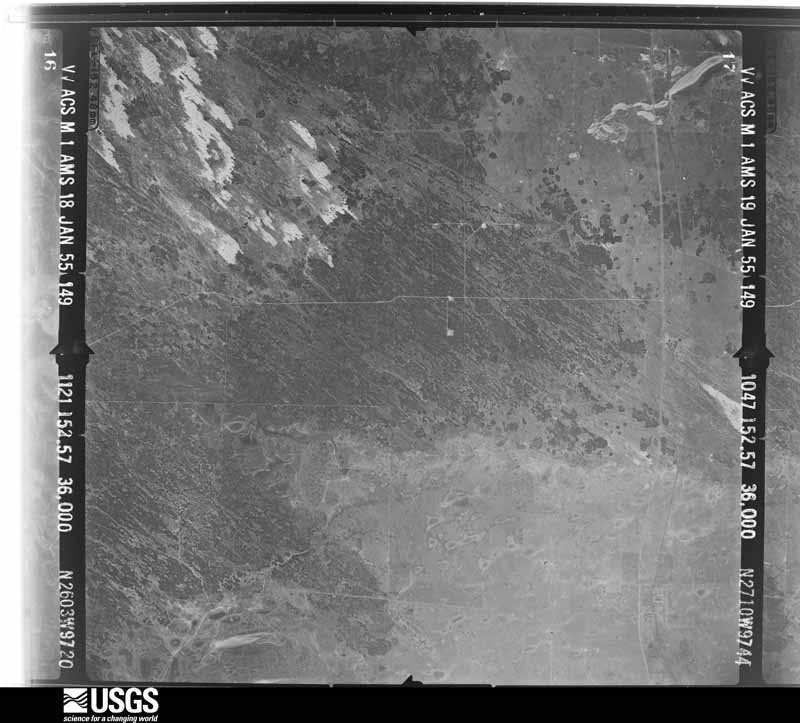
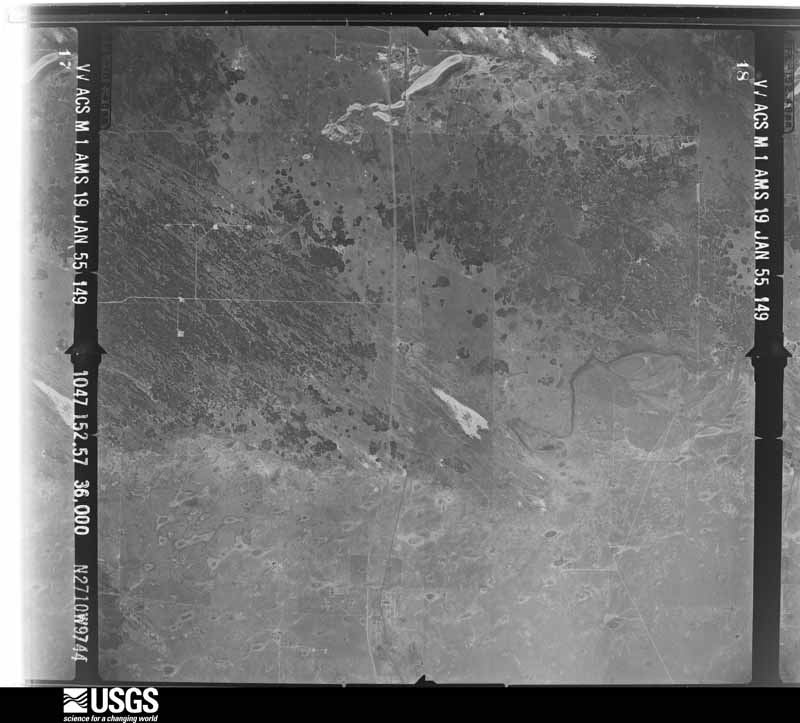
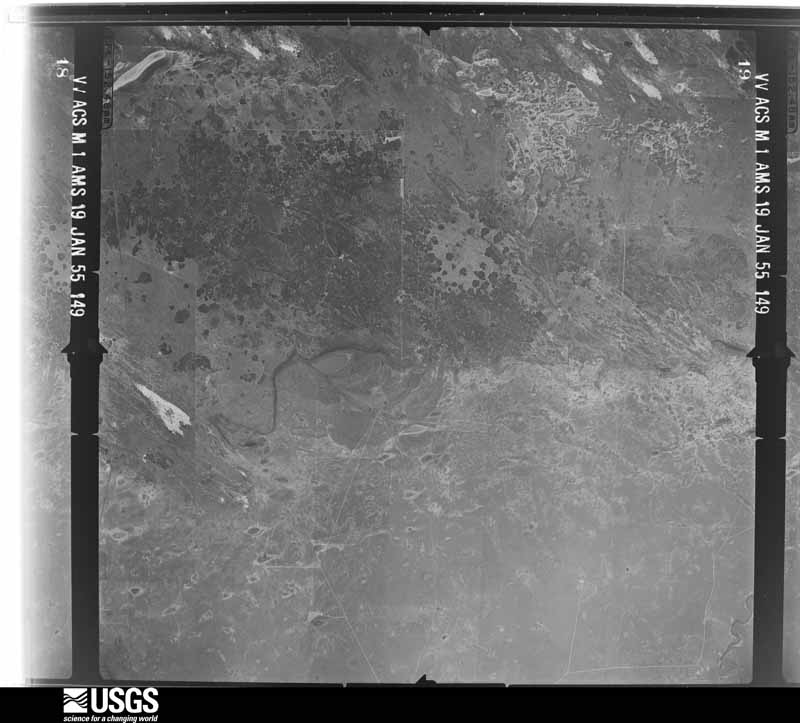
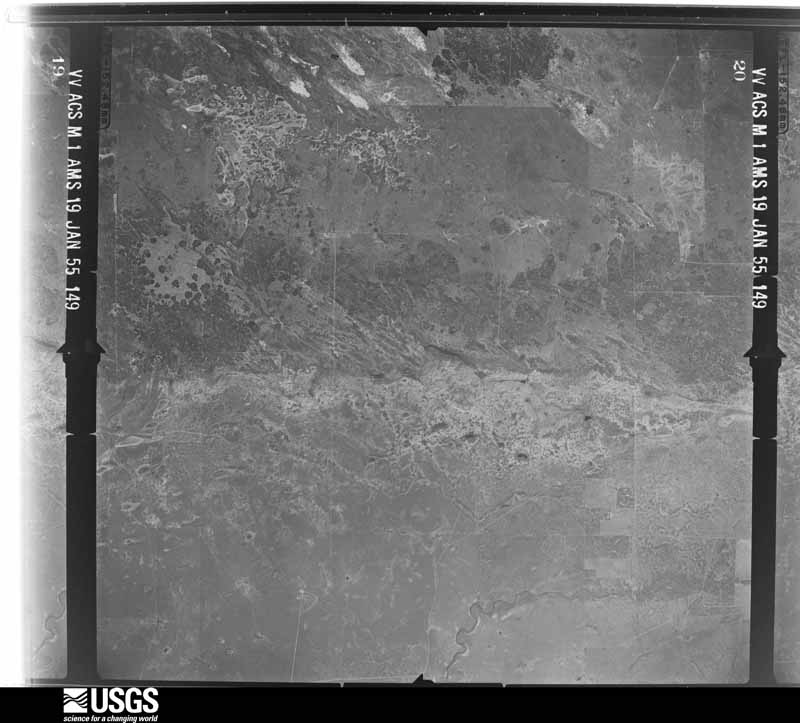
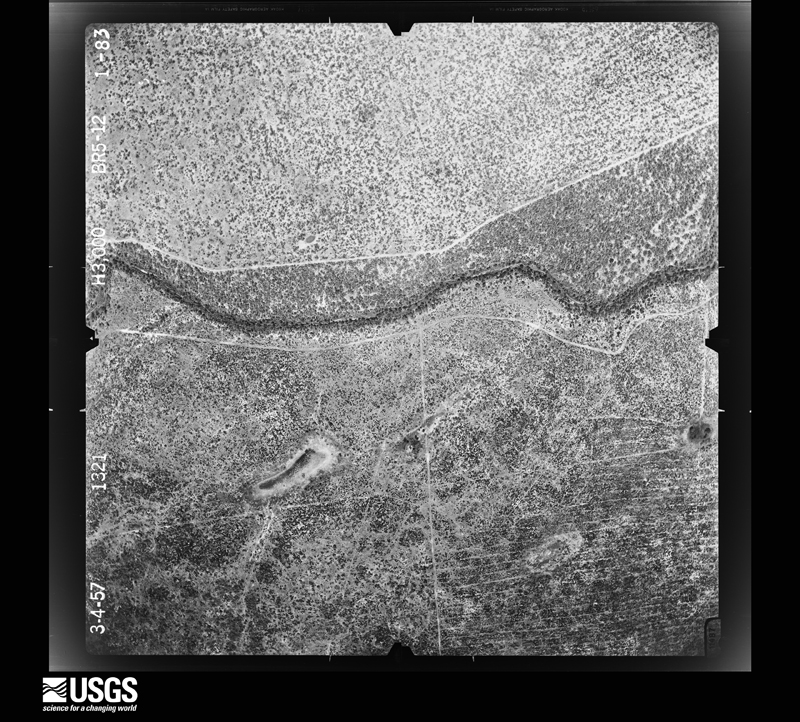
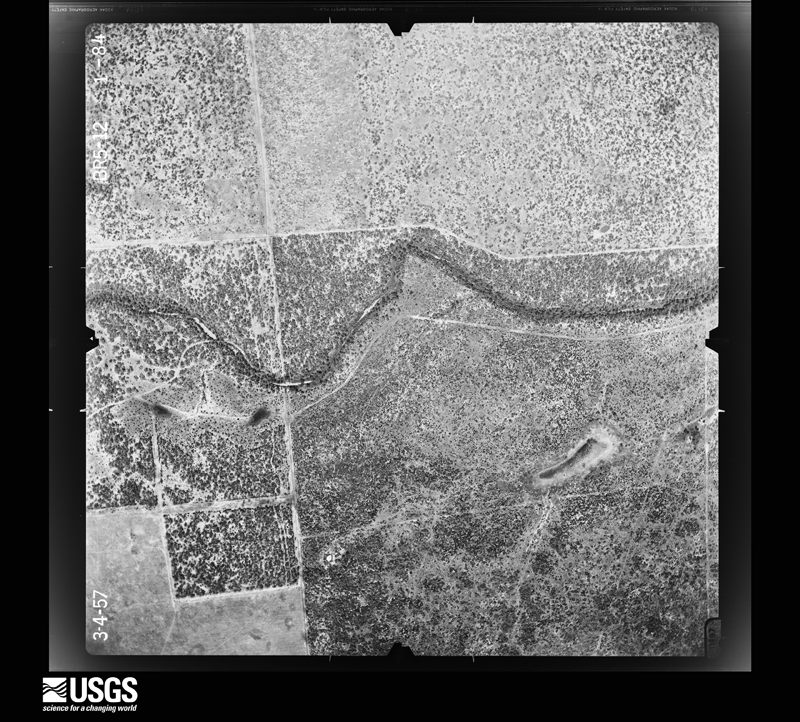
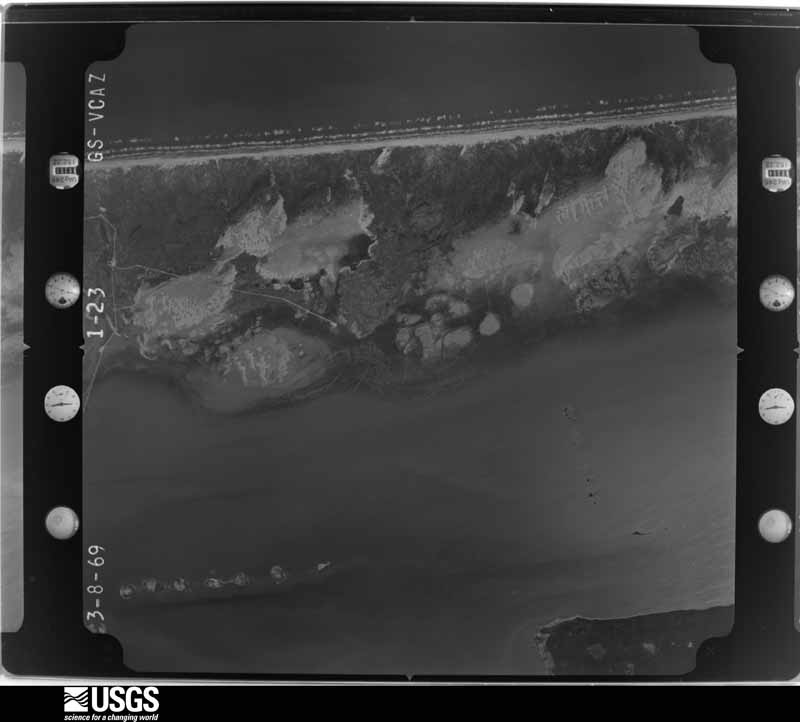
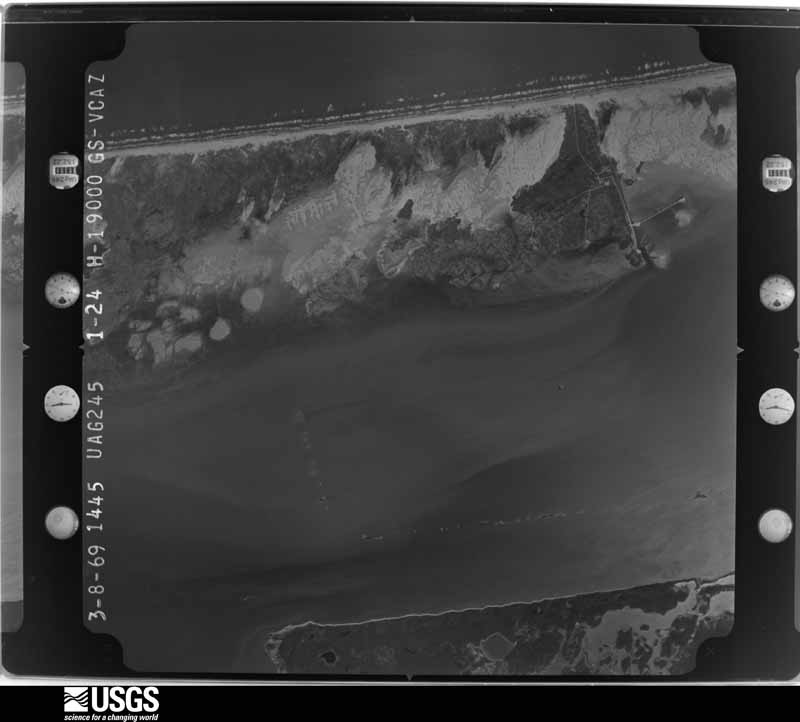




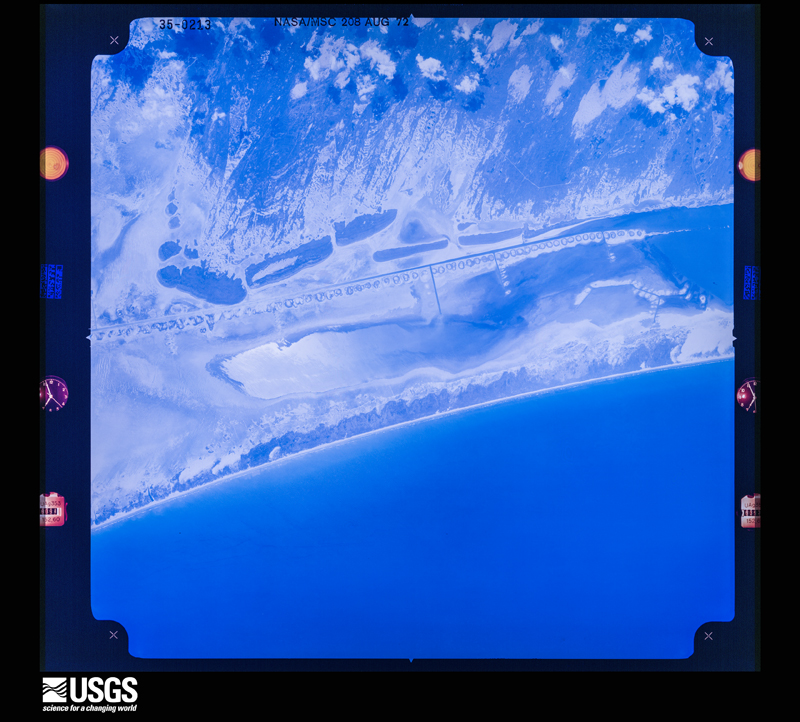
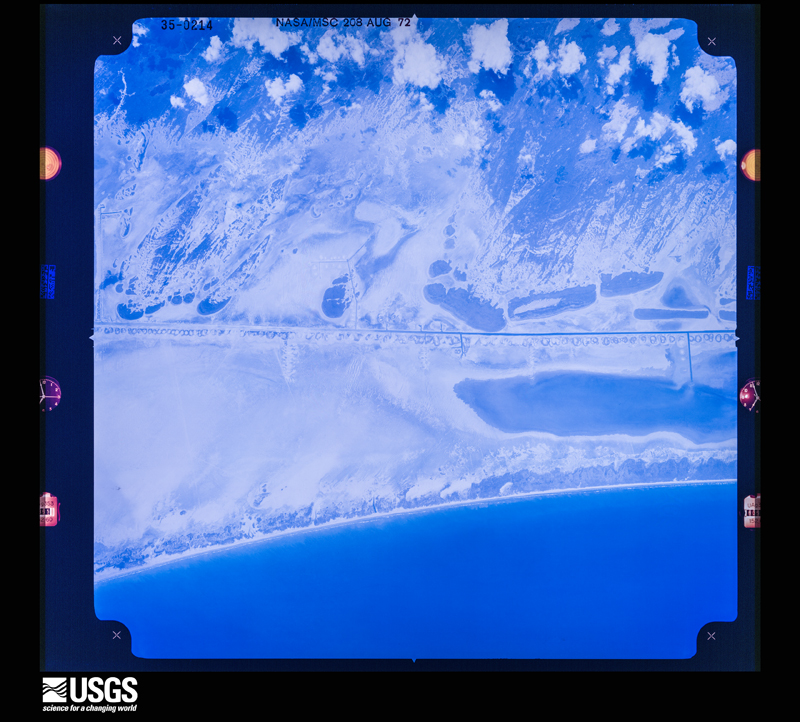
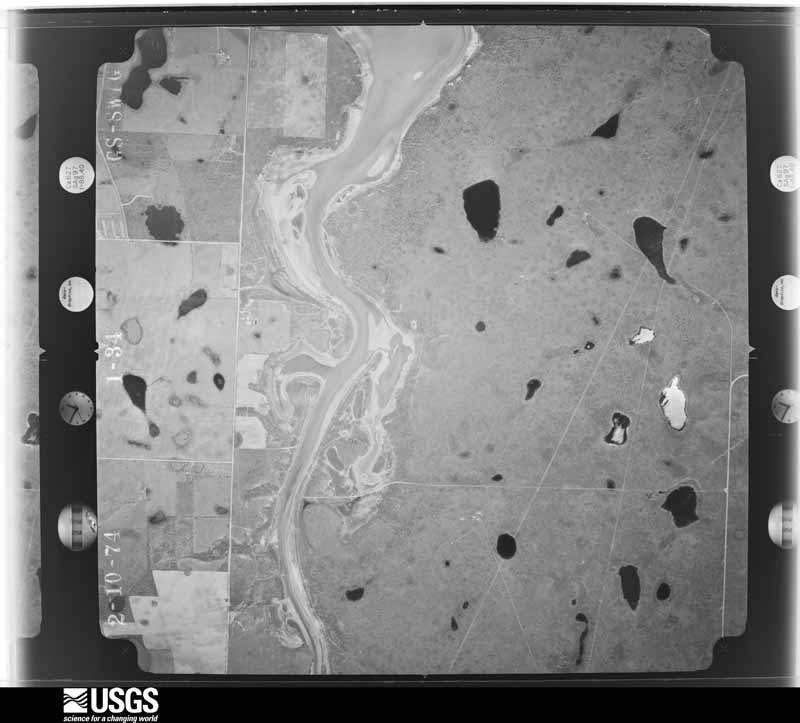
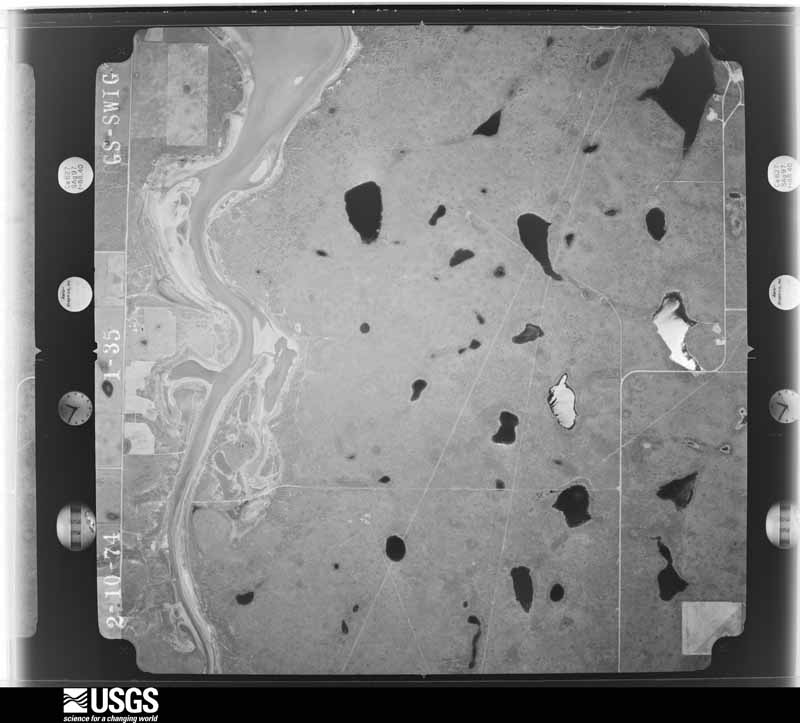



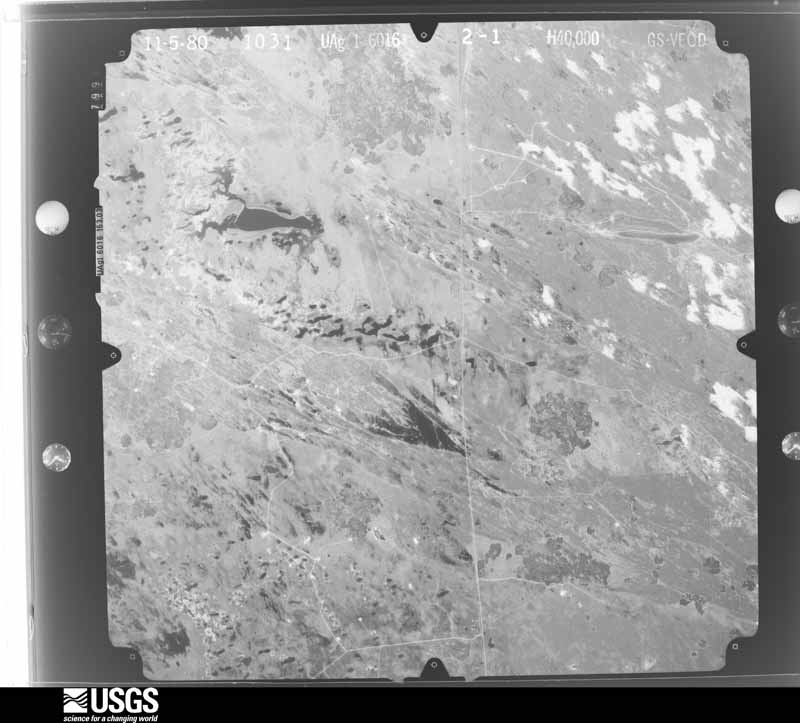
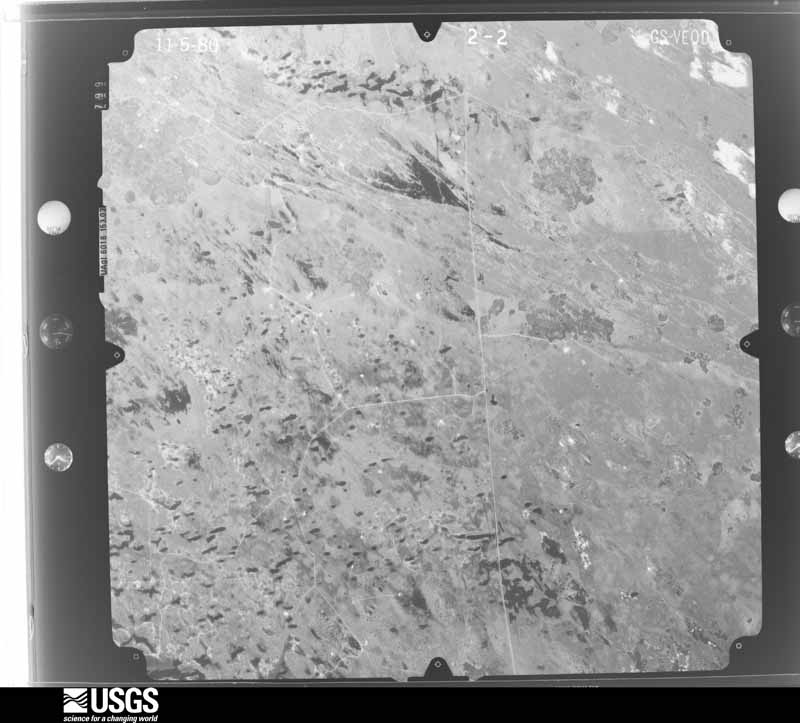
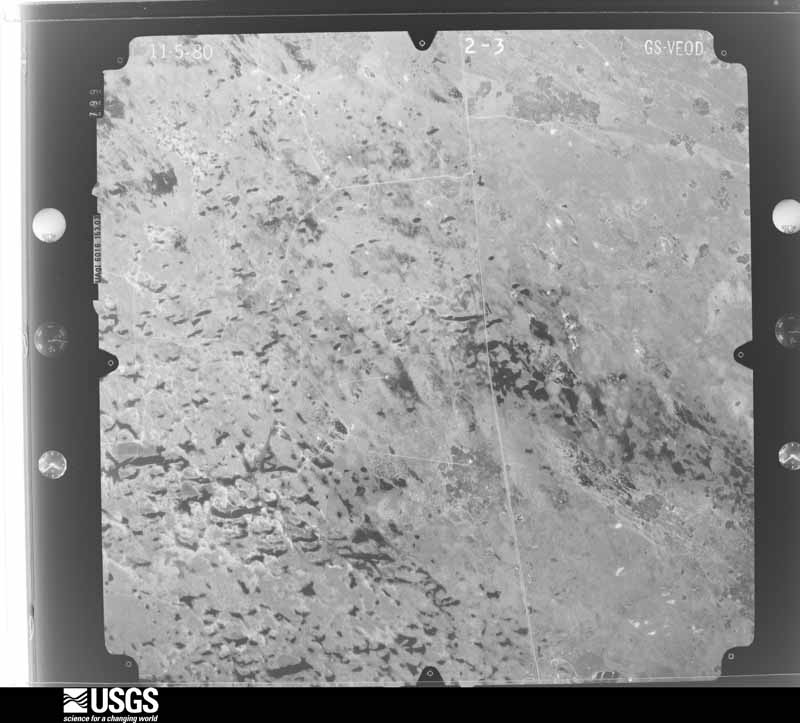
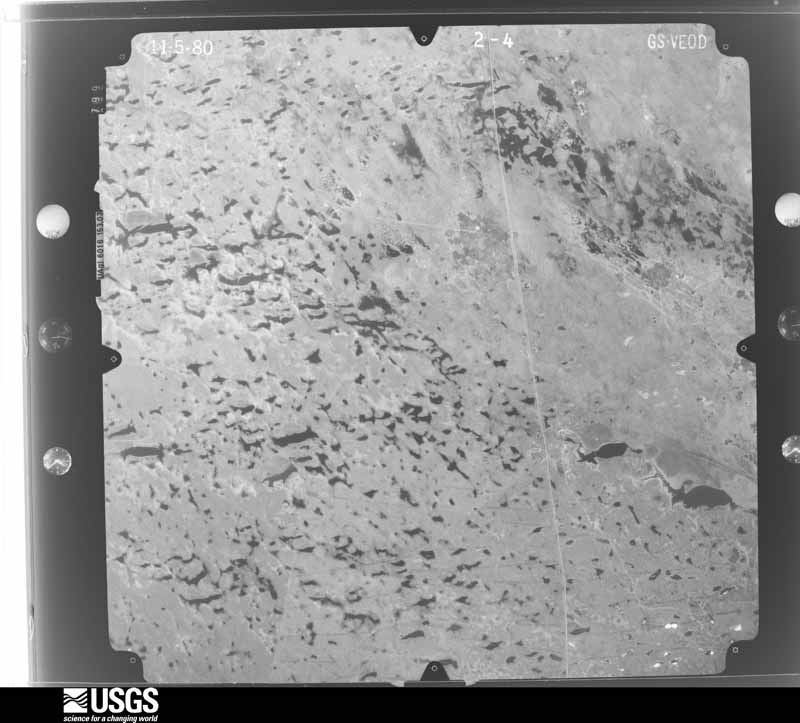
The thermometers that kept this county's weather, as the federal records hold them. The extremes below are measured values from those records, not estimates.
Who lived here in 1950, one enumeration district at a time, as the Census Bureau described each district. Each row opens its official National Archives result, with Population Schedules and ED Maps available there.
Every wildfire the federal occurrence database records inside this county: 171 of them, burning about 66,856 acres. 24 started naturally and 6 were recorded as arson. Each settlement page carries the fires within five miles of it.
| Reported cause | Fires |
|---|---|
| Missing data/not specified/undetermined | 45 |
| Debris and open burning | 44 |
| Natural | 24 |
| Equipment and vehicle use | 19 |
| Railroad operations and maintenance | 13 |
| Smoking | 10 |
| Power generation/transmission/distribution | 7 |
| Arson/incendiarism | 6 |
| Fireworks | 1 |
| Recreation and ceremony | 1 |
| Misuse of fire by a minor | 1 |
The five largest, by the area the report gives. One of them was set deliberately.
| Date | Cause | Size | Reported by | Name on the report |
|---|---|---|---|---|
| 21 December 2017 | Recreation and ceremony | 14,240 acres | Padre Island National Seashore | CANE |
| 2 January 2011 | Missing data/not specified/undetermined | 8,000 acres | South Texas Refuge Complex | KING RANCH |
| 2 April 2009 | Arson/incendiarism | 7,157 acres | Padre Island National Seashore | TURTLE |
| 13 May 2014 | Natural | 5,933 acres | Padre Island National Seashore | 28 MILE |
| 14 April 2018 | Natural | 4,517 acres | Padre Island National Seashore | LIGHTNING14 |
| 7 August 2014 | Missing data/not specified/undetermined | 4,000 acres | Texas A & M Forest Service | KENEDY TRUST FIRE |
| 10 March 2018 | Debris and open burning | 3,000 acres | Texas A & M Forest Service | TRUST |
| 14 February 2011 | Equipment and vehicle use | 2,500 acres | Texas A & M Forest Service | WEST TURCOTTE RANCH |
Every settlement page carries the fires within five miles of it - see the settlement index below.
The NOAA Storm Events Database holds 46 reports for this county, causing no deaths, no injuries and about $36,500 in recorded property damage. Each settlement page carries the reports that name it.
| Kind of event | Reports |
|---|---|
| Hail | 21 |
| Thunderstorm Wind | 16 |
| Tornado | 6 |
| Heavy Rain | 3 |
The most serious of them, by death, then injury, then recorded damage. The accounts are quoted exactly as the forecast office filed them.
| When | Event | Place named | Harm | What the report says |
|---|---|---|---|---|
| May 1995 | Thunderstorm Wind | Countywide | $10,000 | Ranch house damaged. Outbuildings damaged, killing some livestock. |
| October 1995 | Hail | not stated | $10,000 | Breaking swell from Hurricane Opal caused water to spill across at the usual wash-over points damaging several vehicles. |
| October 1995 | Hail | not stated | $10,000 | Breaking swell from Hurricane Opal caused water to spill across at the usual wash-over points damaging several vehicles. |
| May 1999 | Thunderstorm Wind | Norias | $3,000 | Trees and highway signs blown down. |
| May 1999 | Thunderstorm Wind | Norias | $2,000 | Large tree limbs down. |
| March 1999 | Thunderstorm Wind | Sarita | $1,000 | Extensive tree damage. |
| September 1997 | Thunderstorm Wind | Sarita | $500 | no account filed |
| November 2025 | Hail | Sarita | - | Law enforcement reported golf ball sized hail in Sarita, TX. |
| November 2025 | Hail | Mifflin | - | The public posted a social media video showing at least golf ball size hail in Sarita at the Sarita rest stop along US-77. |
| November 2025 | Hail | Turcotte | - | Border Patrol reported golf ball size hail at a checkpoint 14 miles south of Sarita, TX or 6.5 miles north of Armstrong, TX. |
| April 2016 | Hail | Norias | - | Off duty NWS employee reported nickel sized hail on Highway 77 near Norias. |
| April 2016 | Hail | Norias | - | COOP observer in Armstrong reported golfball sized hail. |
| August 2014 | Heavy Rain | Norias | - | CO-OP observer in Armstrong reported 5.12 inches of rainfall. |
| May 2012 | Hail | Turcotte | - | Border patrol checkpoint 15 miles south of Sarita reported predominantly nickel size hail with embedded quarter size hail. |
| March 2012 | Thunderstorm Wind | Sarita | - | The Meteorologist-in-Charge of the NWS office in Brownsville witnessed a downburst/microburst about one mile east of U.S. Highway 77 approximately 10 miles south of Sarita. The microburst produced a tremendous amount of dust; winds were estimated the winds to be near 60 mph. |
| March 2012 | Hail | Mifflin | - | Dime to nickel sized hail on Highway 77 was reported by the Border Patrol. |
| April 2012 | Tornado (EF0) | Sarita | - | A tornado was reported on the Kenedy Ranch, approximately 3 miles south of Rivera (Kleberg County). This storm would later produce a damaging tornado near Kingsville. The National Weather Service Office in Corpus Christi relayed the report to from the general public. |
| October 2011 | Heavy Rain | Armstrong | - | The cooperative observer at Armstrong reported 3.64 inches of rain from mid afternoon thunderstorm clusters passing through central Kenedy County on October 9th. Estimated rainfall of 2 to 3 inches also fell in northern Willacy County as the clusters moved and developed toward the Lower Rio Grande Valley. |
| October 2009 | Thunderstorm Wind | Norias | - | The Rincon Del San Jose TCOON site reported a wind gusts to 66 miles per hour during a thunderstorm which moved through the coastal areas early in the afternoon. Note: This location is immediately east of the Kenedy County Laguna Madre coastline and is used as a proxy to estimate winds over this area. |
| September 2009 | Heavy Rain | Sarita | - | A CO-OP observer reported 2.41 inches of rain fell during a thunderstorm which moved through the Sarita area during the early afternoon Sunday September 11th. |
| October 2009 | Thunderstorm Wind | Sarita | - | A Texas Coastal and Ocean Observing Network site at Baffin Bay, just a few miles northeast of Kenedy County, recorded wind gusts up to 65 mile per hour when line of strong to severe thunderstorms rapidly developed in western Kenedy County and raced east. Wind gusts at or above 60 mph continued until 1236 PM. Note: Wind gust value is used as a proxy to estimated value on the nearby promontory of northeast Kenedy County. |
| February 2008 | Hail | Rudolph | - | A trained spotter reported an isolated thunderstorm produced hail up to 1.25 inches in diameter in an area approximately 9 miles North Northeast of Raymondville. |
| May 2006 | Tornado (F0) | Sarita | - | Tornado was reported by the U.S. Border Patrol near Armstrong. The tornado touched down over open ranch land and produced no damage. |
| May 2006 | Hail | Sarita | - | Large hail was reported by a CO-OP observer. |
| April 2004 | Hail | Sarita | - | Large hail was reported by the general public. |
| May 2001 | Thunderstorm Wind | Sarita | - | Thunderstorm wind gust of 60 mph was reported by a NWS cooperative observer east of Sarita. |
| September 2001 | Thunderstorm Wind | Sarita | - | A wind gust of 56 knots (65 mph) was estimated by Border Patrol officials located at the Border Patrol checkpoint on U.S. Highway 77, 10 miles south of Sarita. |
| March 2000 | Tornado (F0) | Norias | - | A classic supercell thunderstorm produced a brief tornado that knocked over trees in a 200 yard swath on the Santa Cecilia ranch. This tornado was observed by a citizen living on the ranch. |
| May 2000 | Thunderstorm Wind | Sarita | - | Border patrol checkpoint located at Sarita estimated 75 mph winds associated with a squall line or a line echo wave pattern thunderstorm complex. |
| June 2006 | Hail | Norias | - | no account filed |
| May 2005 | Hail | Sarita | - | no account filed |
| May 2005 | Hail | Sarita | - | no account filed |
| May 2005 | Hail | Sarita | - | no account filed |
| April 2003 | Hail | Sarita | - | no account filed |
| May 1999 | Hail | Sarita | - | no account filed |
| April 1999 | Hail | Norias | - | no account filed |
| May 1999 | Thunderstorm Wind | Norias | - | no account filed |
| May 1999 | Hail | Sarita | - | no account filed |
| May 1999 | Hail | Norias | - | no account filed |
| May 1996 | Thunderstorm Wind | Port Mansfield | - | no account filed |
| May 1992 | Thunderstorm Wind | not stated | - | no account filed |
| August 1980 | Thunderstorm Wind | not stated | - | no account filed |
| August 1980 | Tornado (F0) | not stated | - | no account filed |
| July 1979 | Thunderstorm Wind | not stated | - | no account filed |
| June 1973 | Tornado (F0) | not stated | - | no account filed |
| June 1965 | Tornado (F3) | not stated | - | no account filed |
Named settlements recorded in the Geographic Names Information System, each with the topographic sheets covering it. Villages, hamlets and abandoned places alike. Each is shown with the nearest named watercourse or landform and the survey quadrangle it falls on.