 Block
BlockFrom the record
1 National Register listing published here.
Sources: the National Register database, National Park Service
10 topographic sheets cover 5 settlements here, and 1 property is on the National Register of Historic Places.
1 National Register listing published here.
Sources: the National Register database, National Park Service
Every property in this county listed on the National Register of Historic Places, with the year it was listed and the federal nomination document.
| Photograph | Property | Type | Listed | Reference |
|---|---|---|---|---|
 | Roberts County Courthouse | building | 2004 | 04000228 |
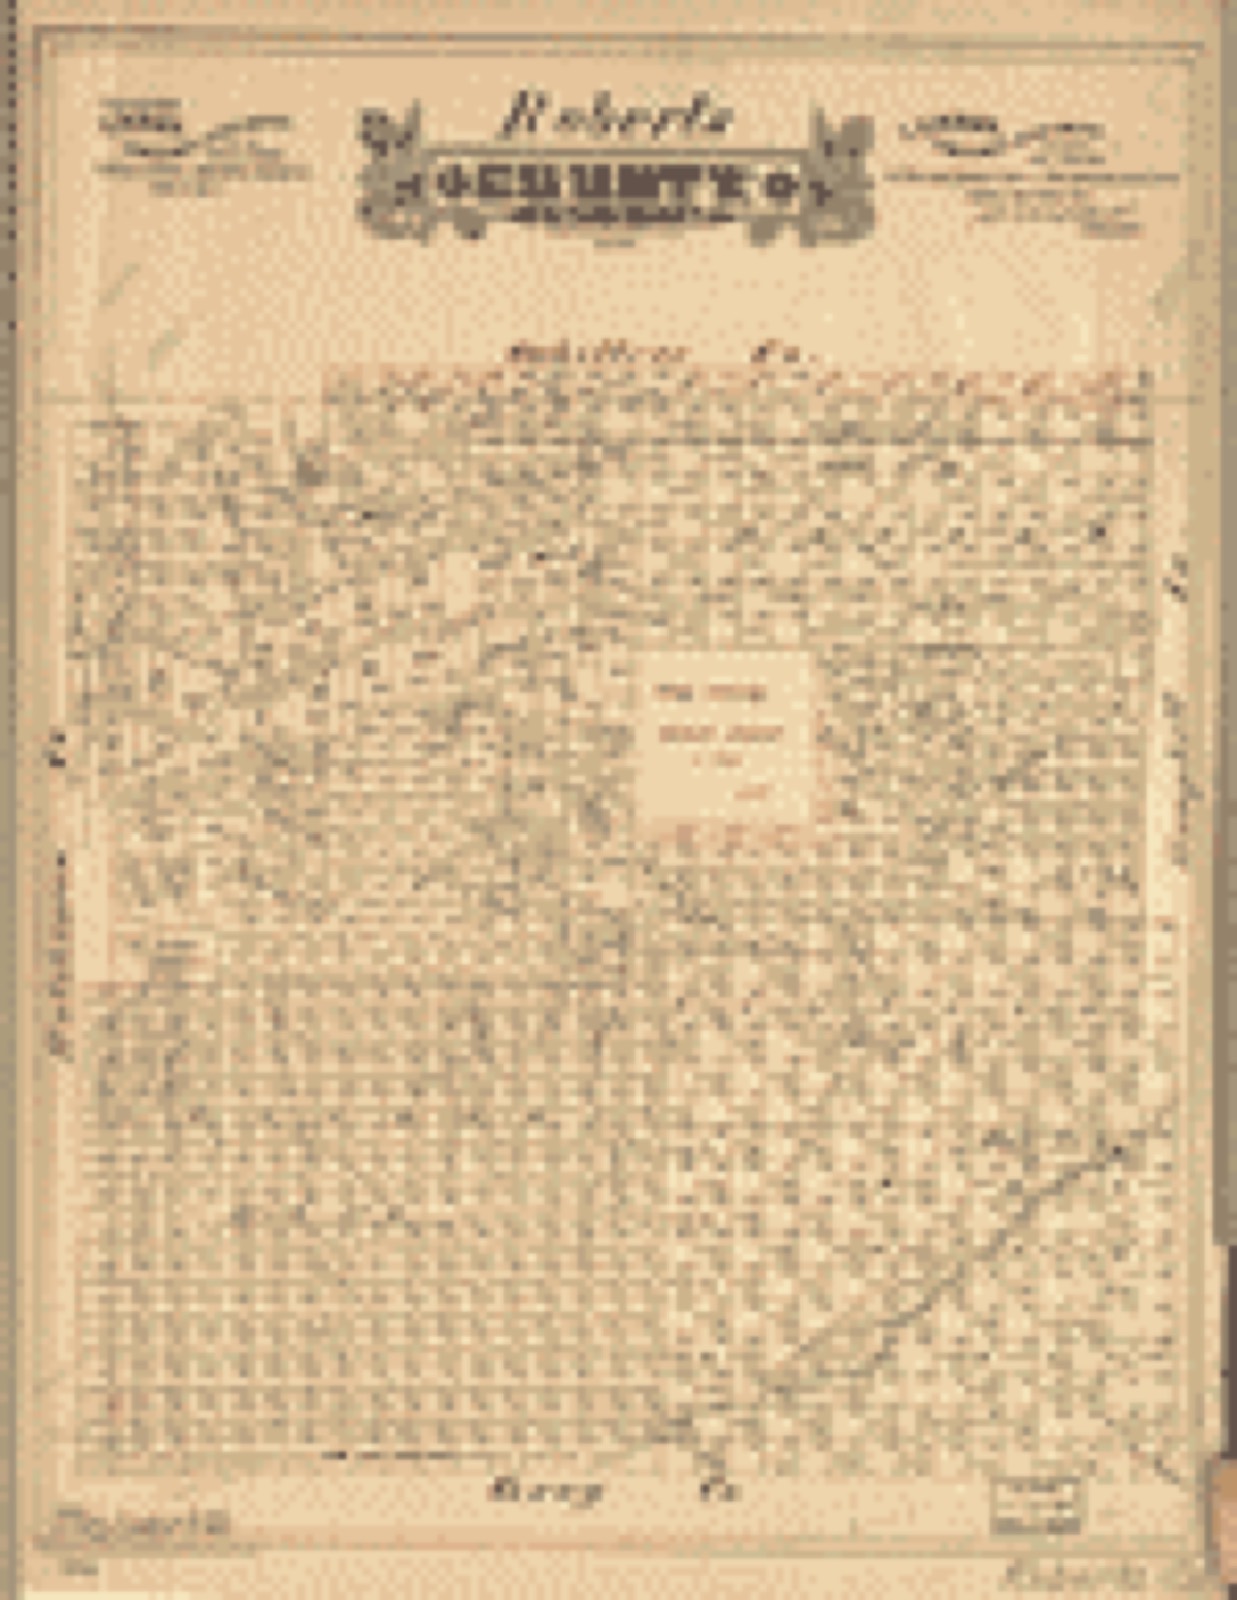
Drawn when these were printed as single large sheets: the town seen from the air, and the county divided into its farms with every owner named. Each opens the original at the Library of Congress.
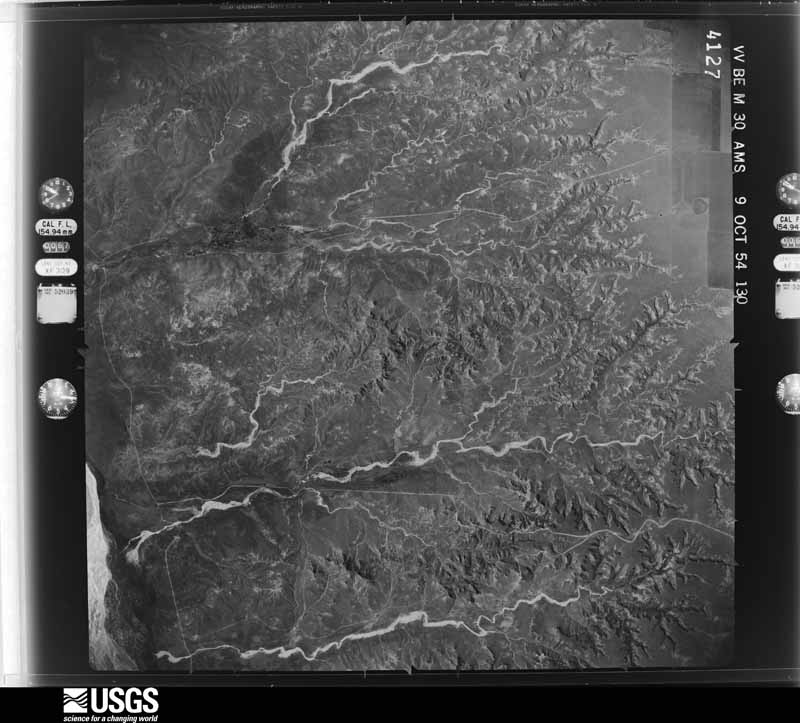
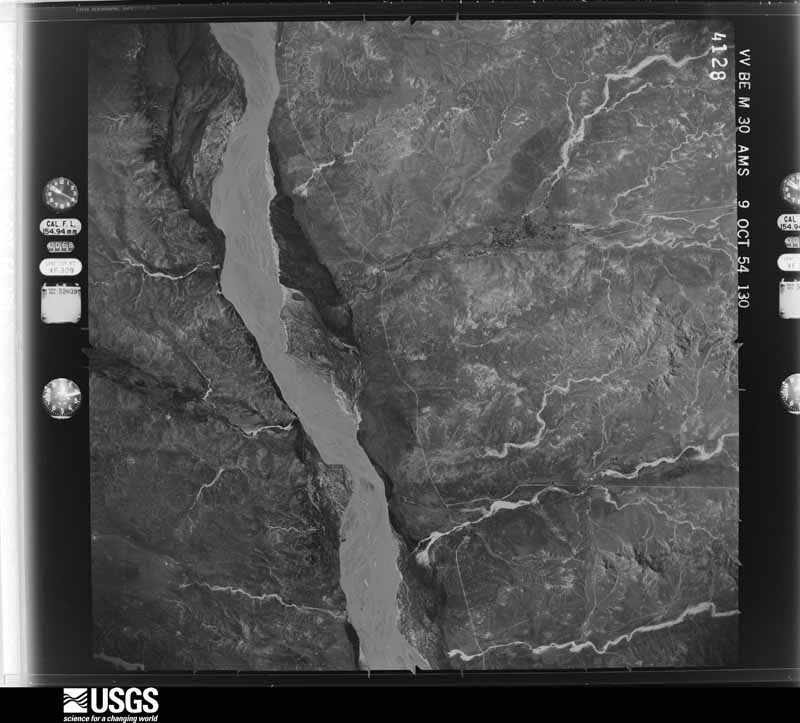
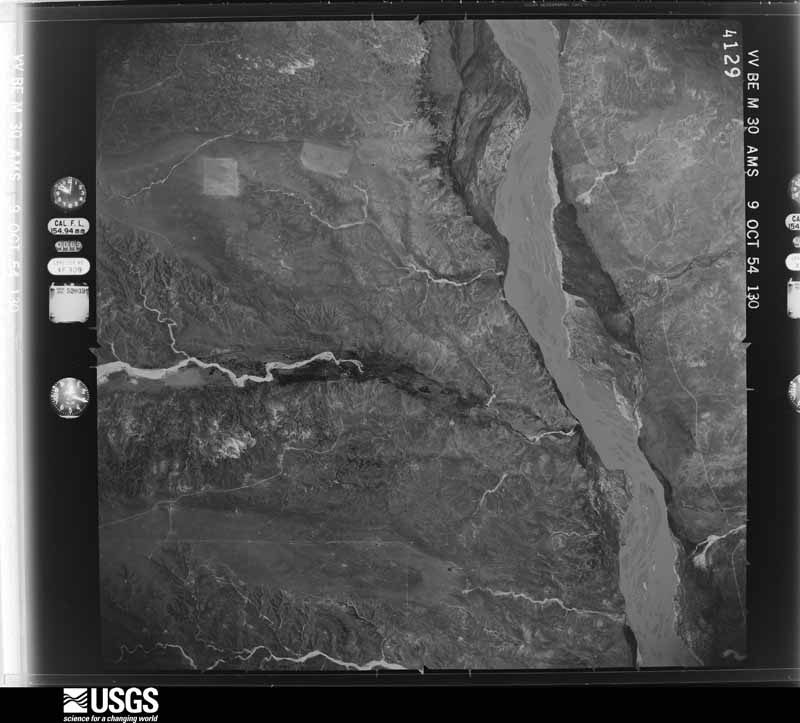
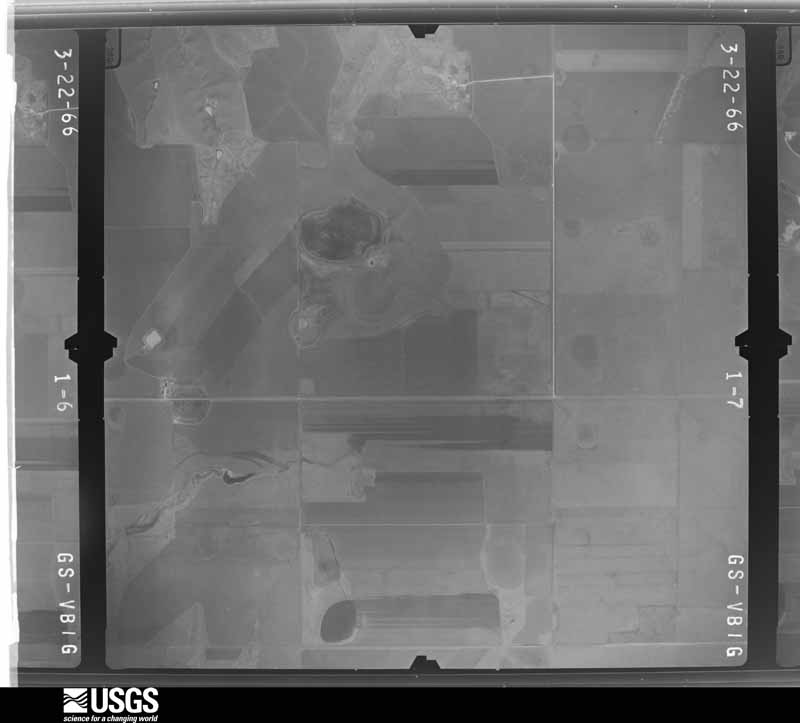
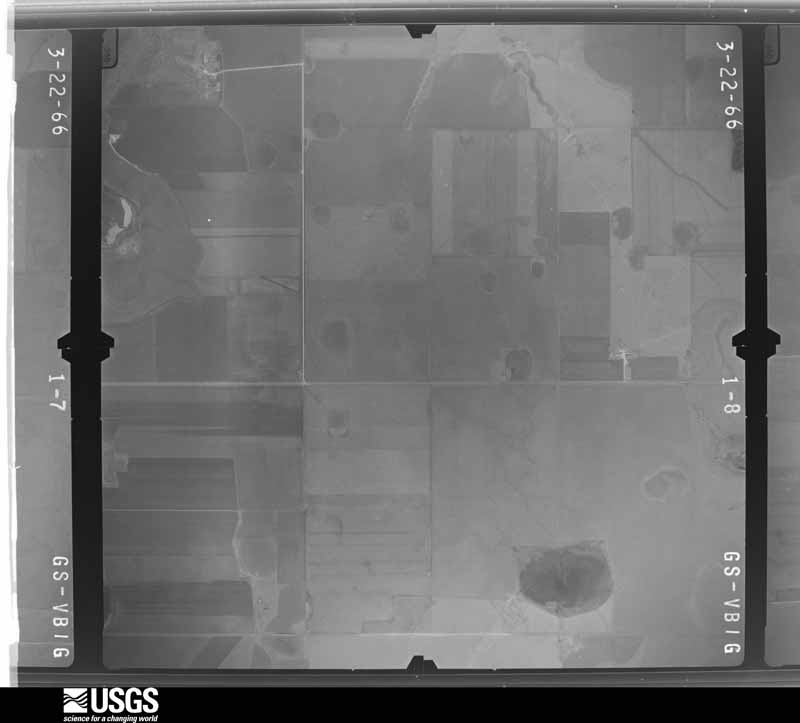
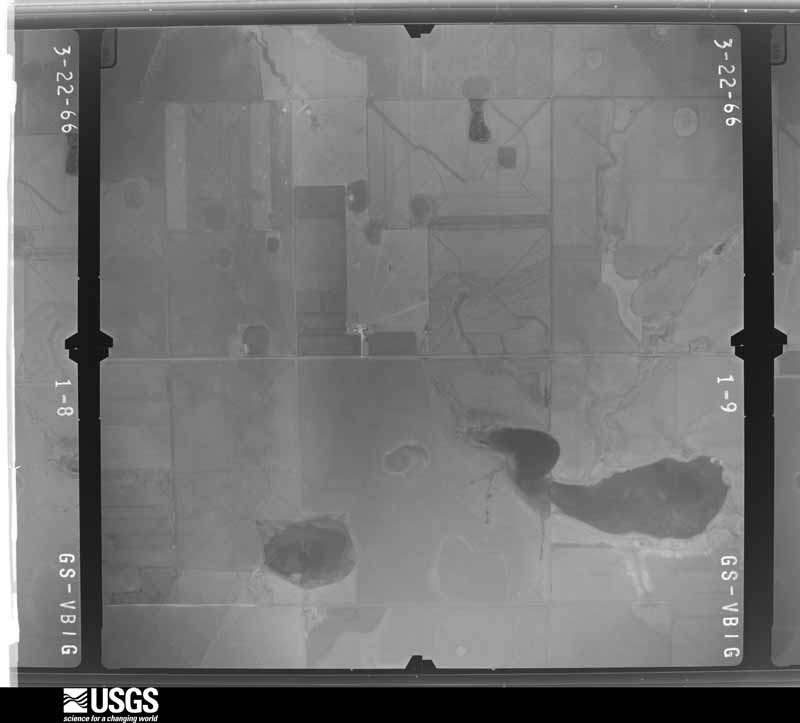
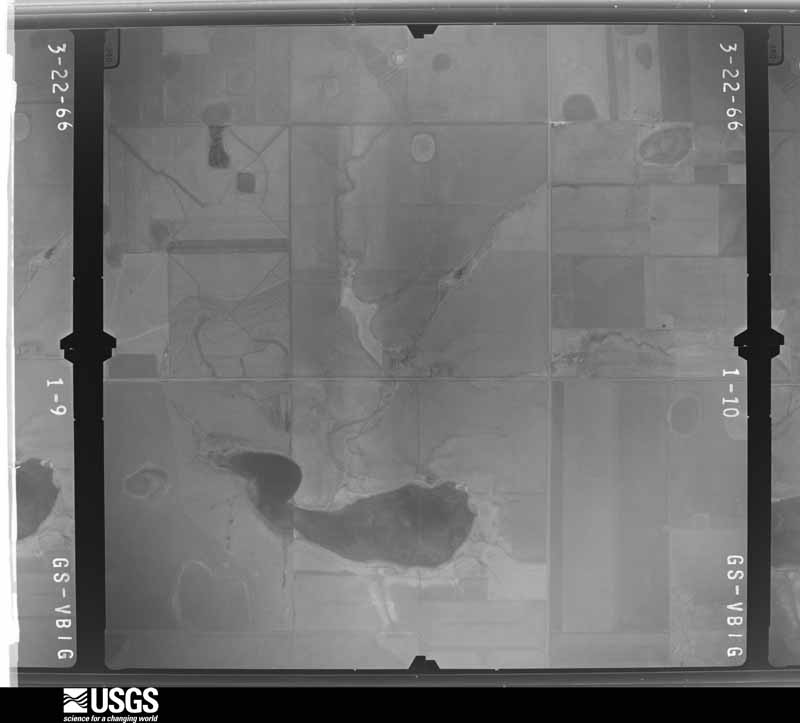
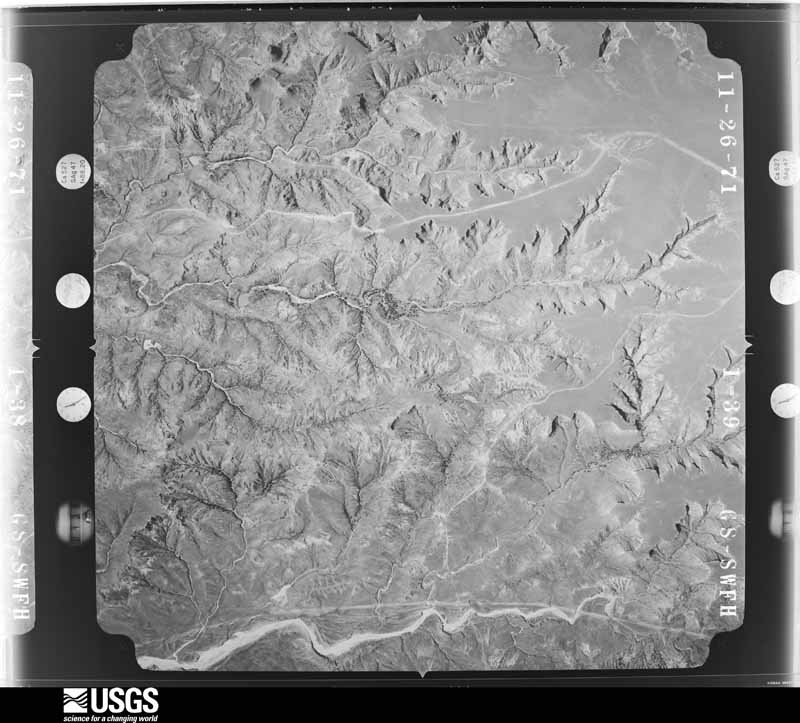
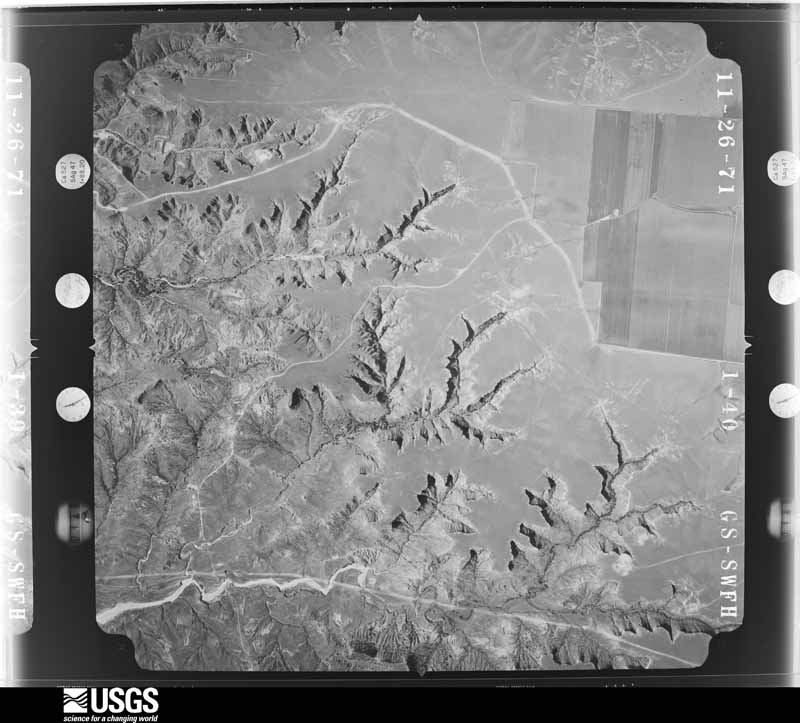
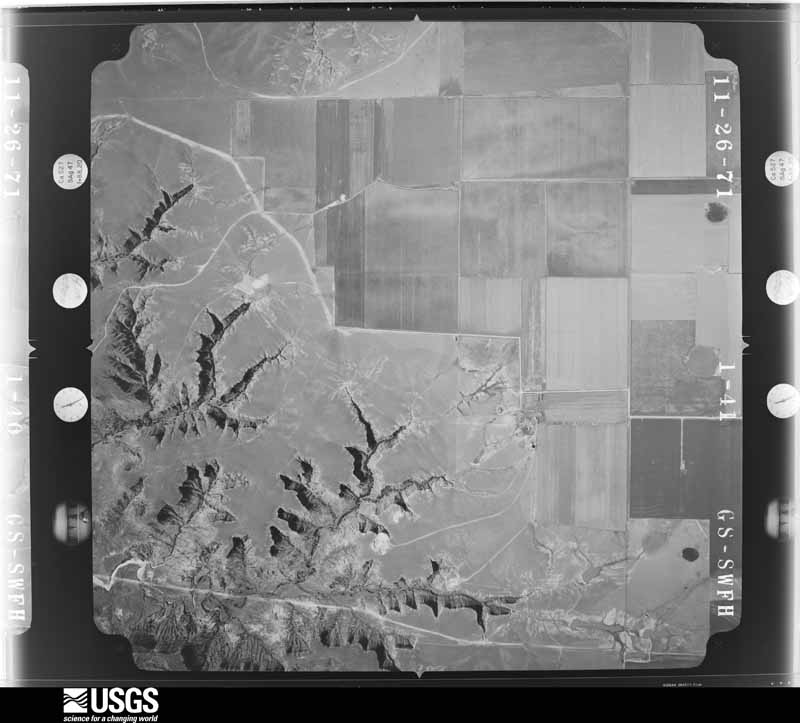
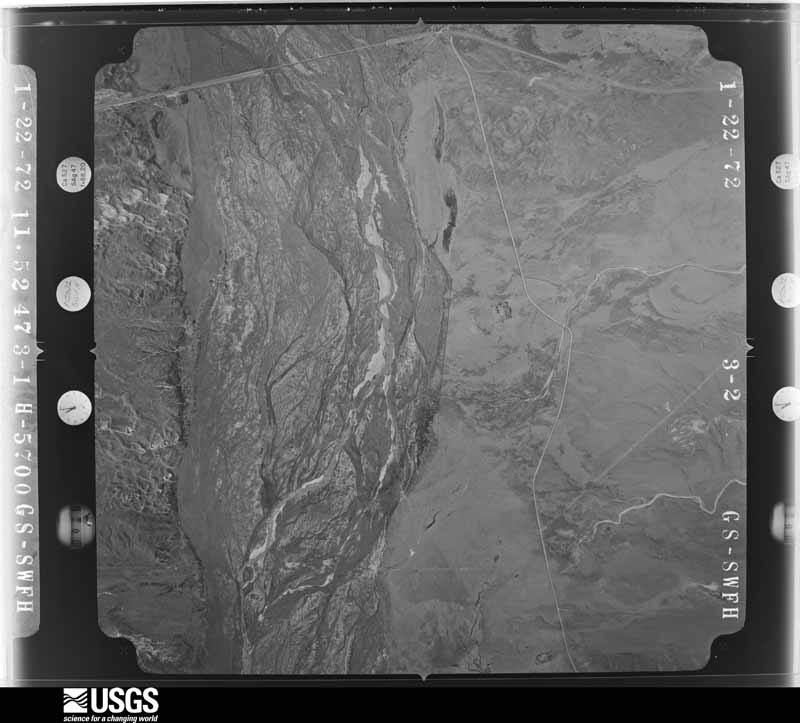
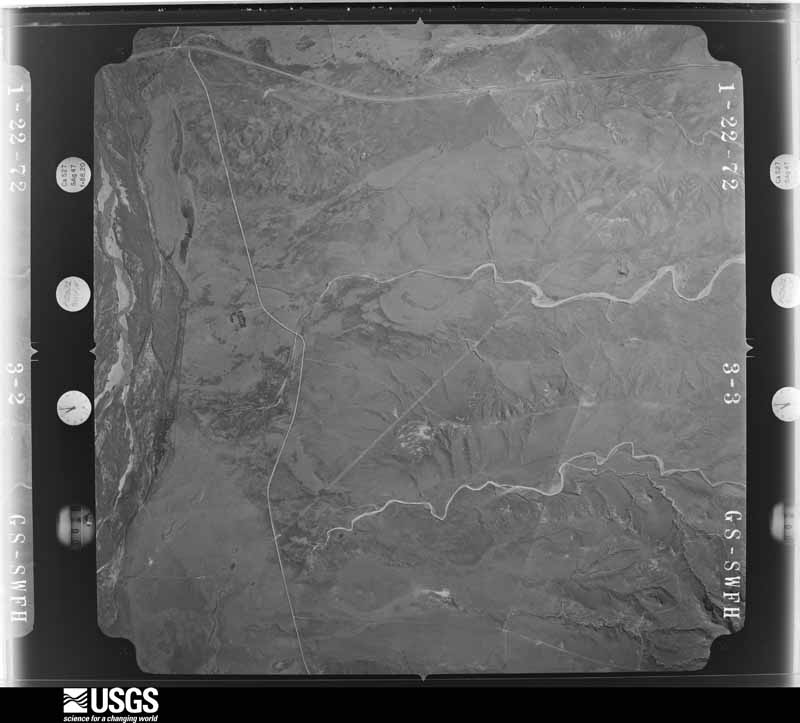
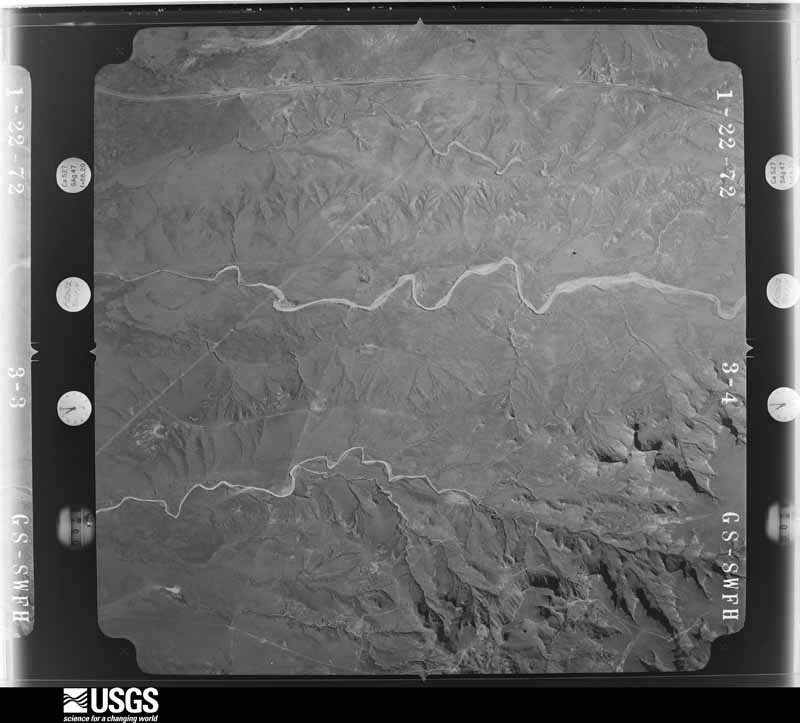
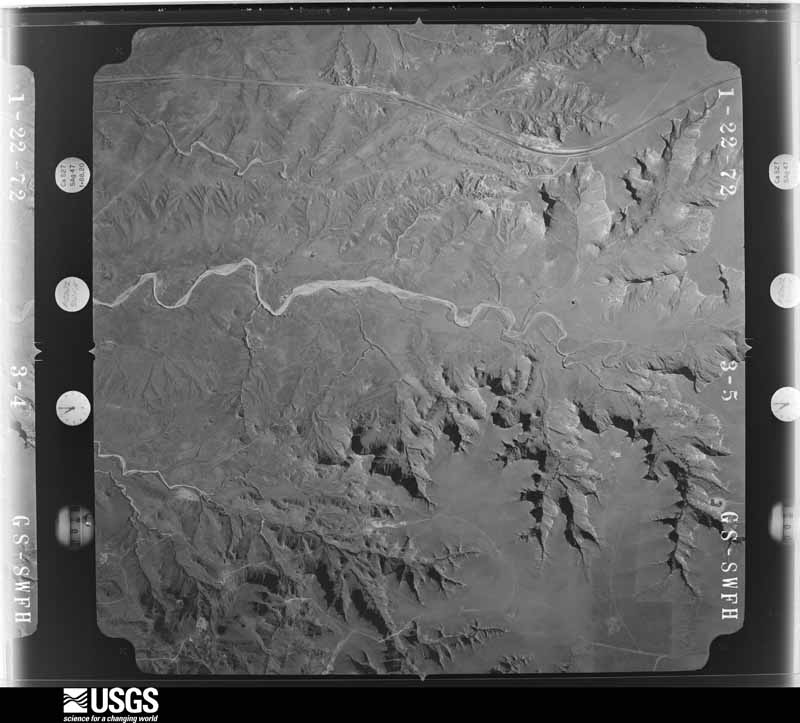
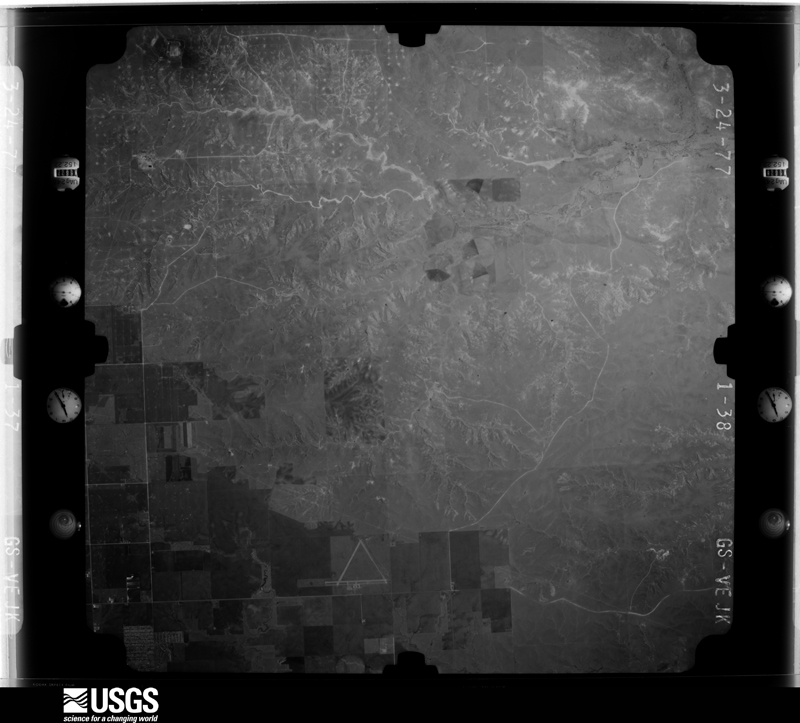
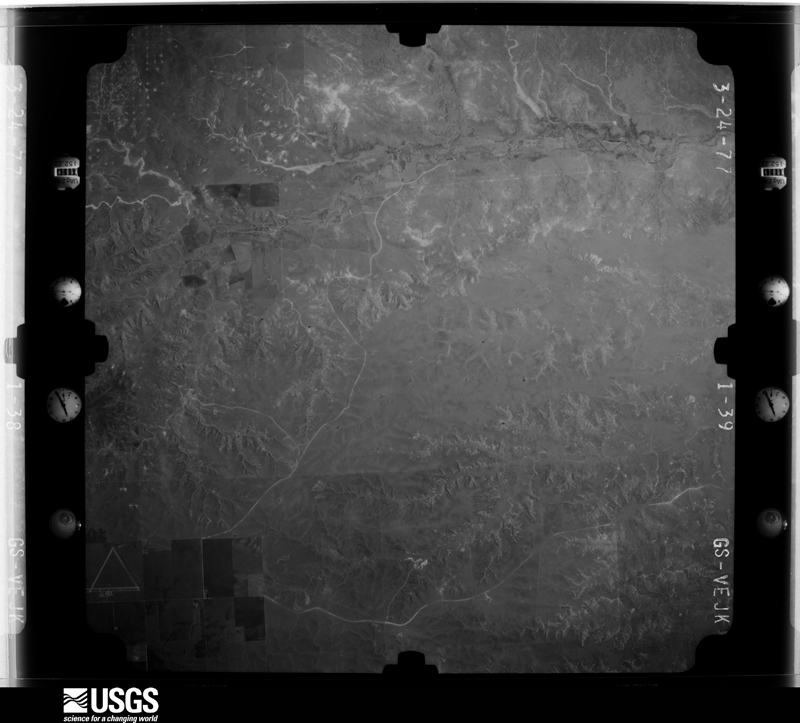
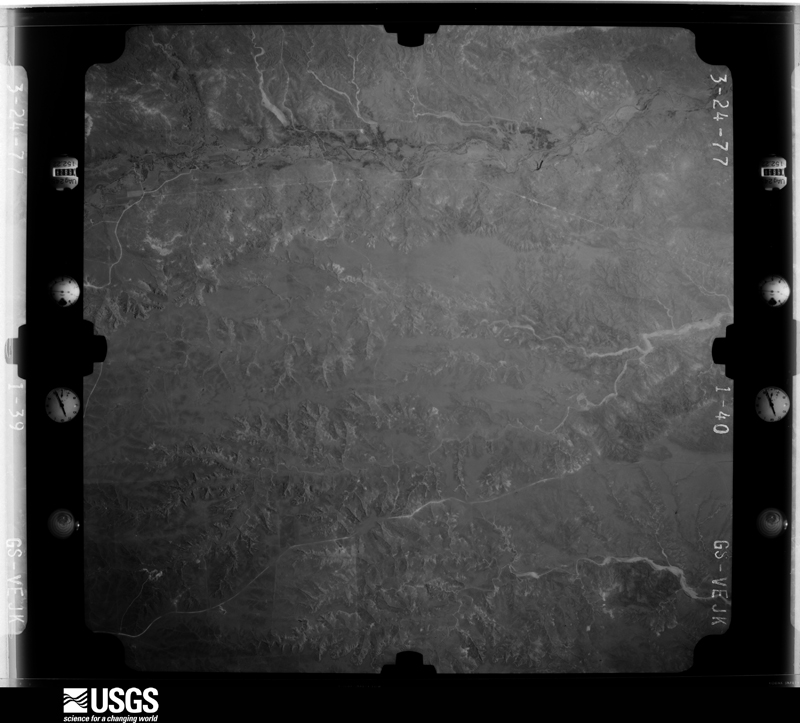
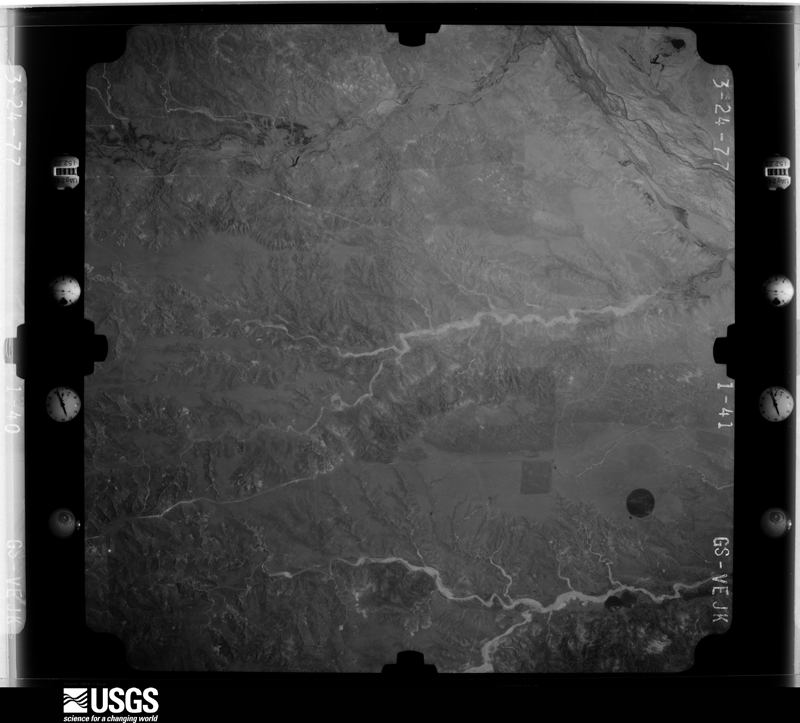
Flown by the U.S. Geological Survey between 1937 and 1989, the Aerial Photo Single Frames collection is the definitive mid-century view of the land: fields, roads and rivers as the camera saw them. The Survey holds 1,039 frames inside the rectangle that bounds this county; the 28 frames below were taken over the county itself, chosen across the decades of flights (at most four a year from that rectangle), so one flight cannot crowd out the rest. The full set is free to browse and download at EarthExplorer under the dataset Aerial Photo Single Frames.
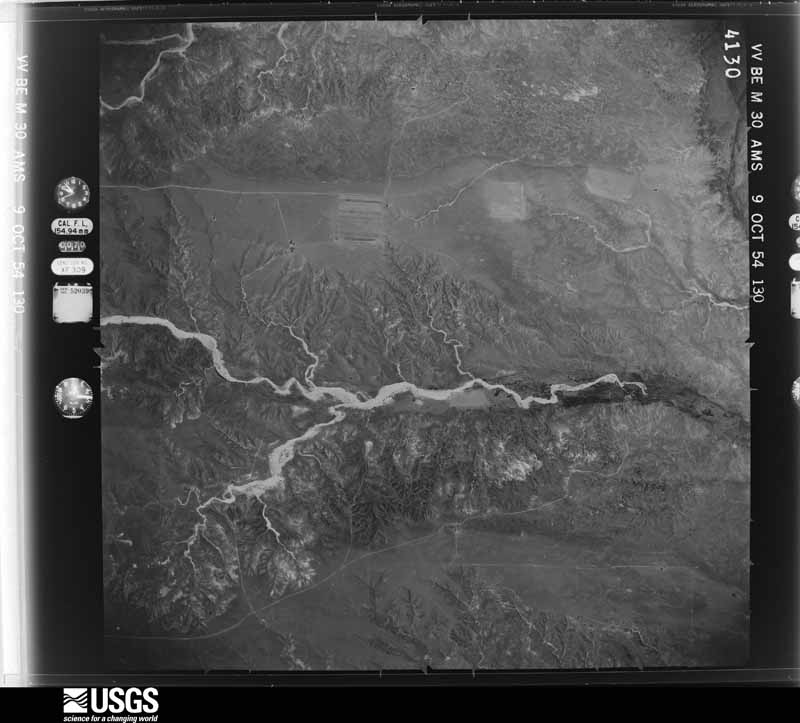
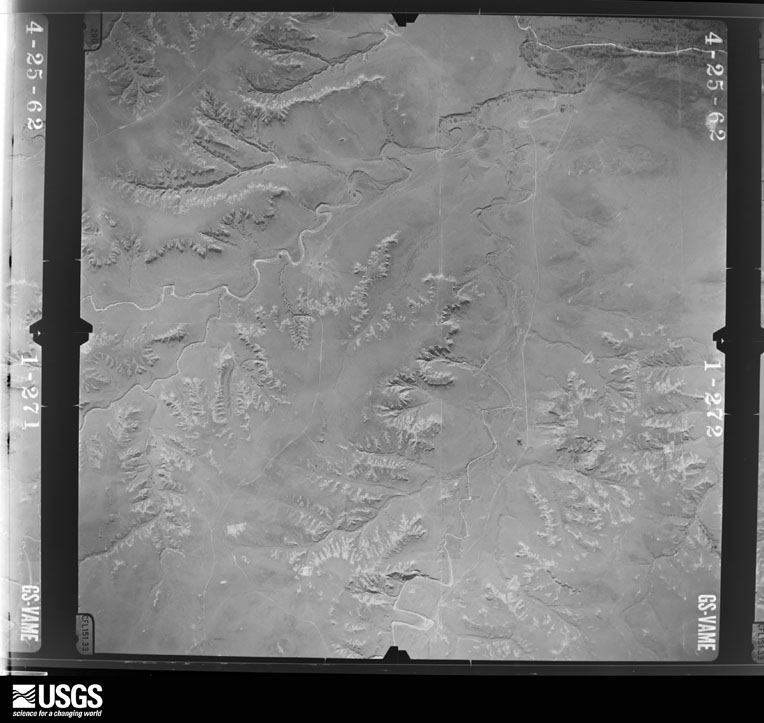

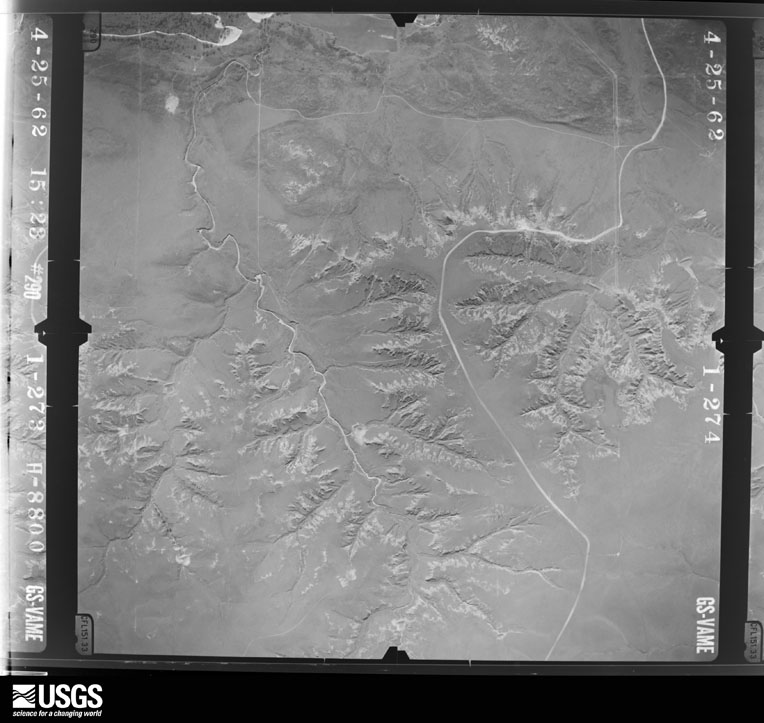
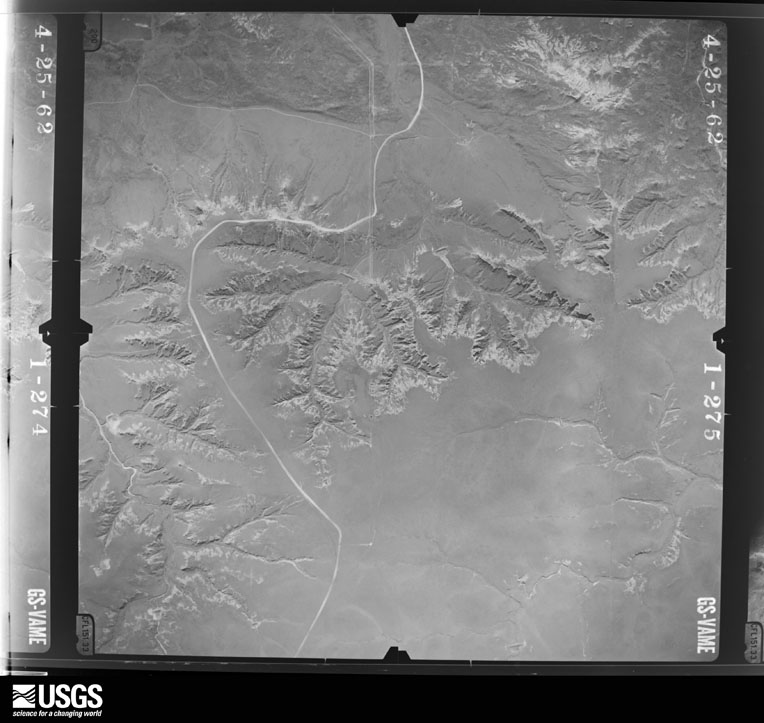
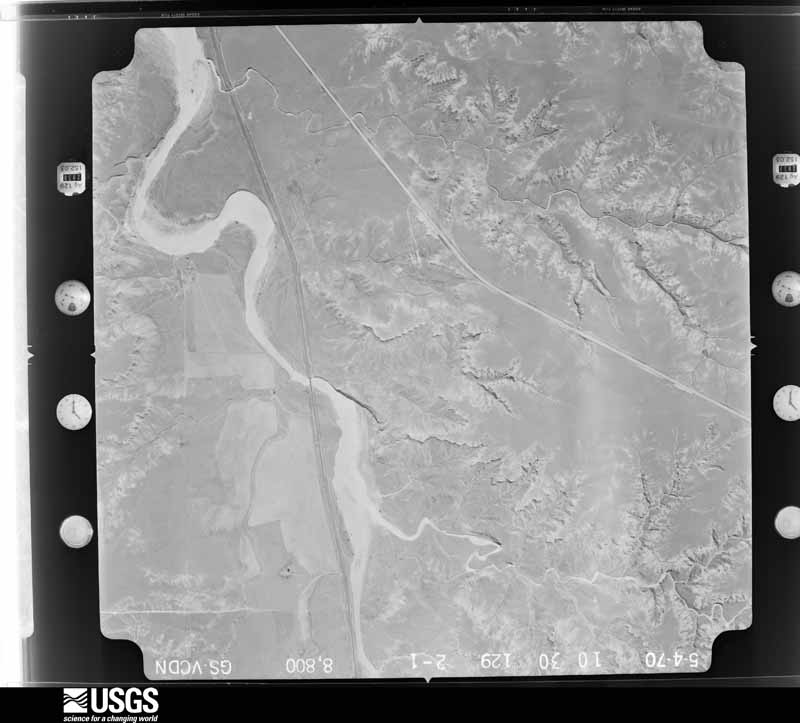
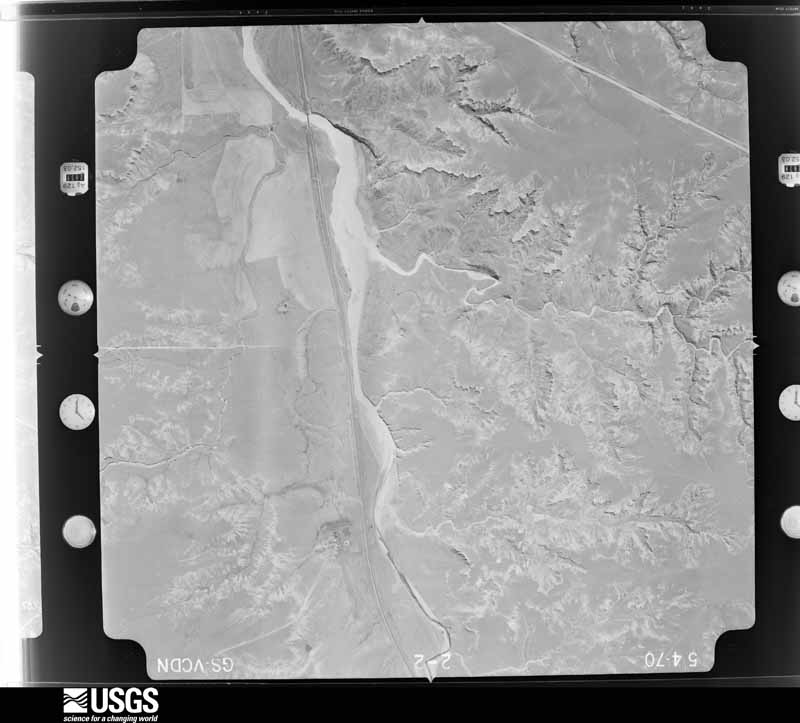
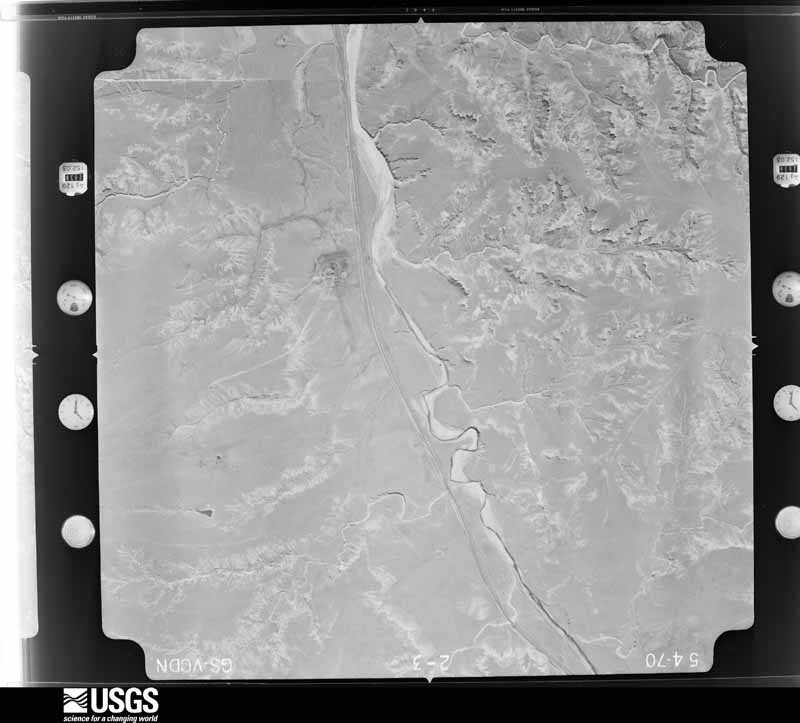
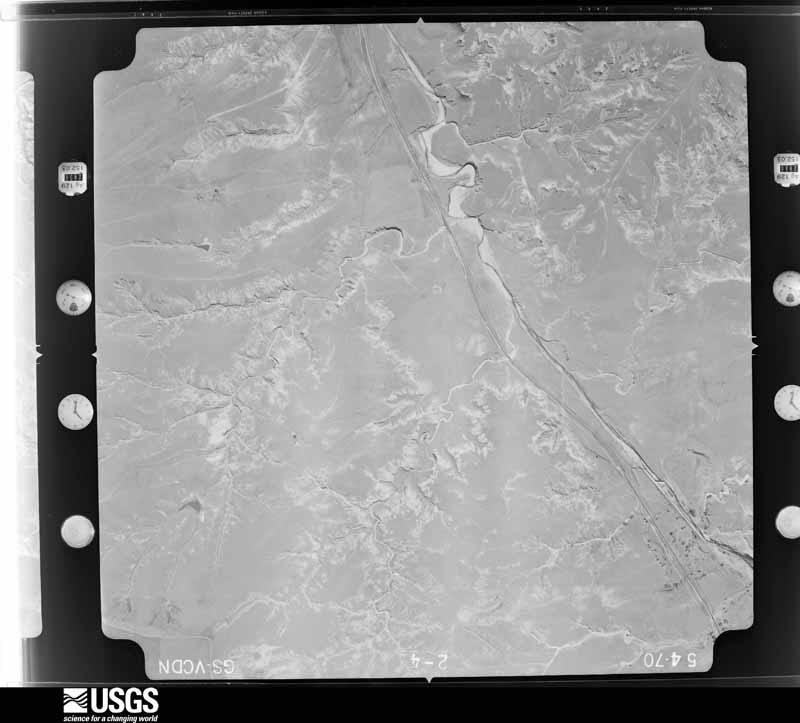

The thermometers that kept this county's weather, as the federal records hold them. The extremes below are measured values from those records, not estimates.
Who lived here in 1950, one enumeration district at a time, as the Census Bureau described each district. Each row opens its official National Archives result, with Population Schedules and ED Maps available there.
Every wildfire the federal occurrence database records inside this county: 77 of them, burning about 96,660 acres. 16 started naturally and 3 were recorded as arson. Each settlement page carries the fires within five miles of it.
| Reported cause | Fires |
|---|---|
| Missing data/not specified/undetermined | 36 |
| Natural | 16 |
| Equipment and vehicle use | 13 |
| Power generation/transmission/distribution | 7 |
| Arson/incendiarism | 3 |
| Debris and open burning | 2 |
The five largest, by the area the report gives. None of them was recorded as arson.
| Date | Cause | Size | Reported by | Name on the report |
|---|---|---|---|---|
| 23 March 2017 | Power generation/transmission/distribution | 38,104 acres | Texas A & M Forest Service | RANKIN RANCH ROAD |
| 11 October 2020 | Equipment and vehicle use | 11,520 acres | Texas A & M Forest Service | JACKALOPE |
| 12 July 2016 | Missing data/not specified/undetermined | 10,789 acres | Texas A & M Forest Service | CHISUM RANCH |
| 27 February 1996 | Missing data/not specified/undetermined | 10,771 acres | Texas A & M Forest Service | HIGHWAY 70 FIRE |
| 11 July 2020 | Natural | 3,100 acres | Texas A & M Forest Service | CAMPBELL RD |
| 7 August 2012 | Natural | 3,000 acres | Texas A & M Forest Service | RONNIE GILL |
| 16 January 2006 | Missing data/not specified/undetermined | 2,400 acres | Texas A & M Forest Service | WEST ZONE WEST - 35 |
| 13 March 2019 | Power generation/transmission/distribution | 2,284 acres | Texas A & M Forest Service | BOONE 283 |
Every settlement page carries the fires within five miles of it - see the settlement index below.
The NOAA Storm Events Database holds 346 reports for this county, causing no deaths, 6 injuries and about $3,746,860 in recorded property damage. Each settlement page carries the reports that name it.
| Kind of event | Reports |
|---|---|
| Hail | 219 |
| Thunderstorm Wind | 76 |
| Tornado | 42 |
| Flash Flood | 6 |
| Heavy Rain | 3 |
The most serious of them, by death, then injury, then recorded damage. The accounts are quoted exactly as the forecast office filed them.
| When | Event | Place named | Harm | What the report says |
|---|---|---|---|---|
| May 1968 | Tornado (F3) | not stated | 6 hurt, $2,500,000 | no account filed |
| June 1995 | Tornado (F1) | Miami - | $300,000 | no account filed |
| June 1983 | Tornado (F1) | not stated | $250,000 | no account filed |
| June 1995 | Hail | Miami | $200,000 | no account filed |
| April 2025 | Tornado (EF1) | Codman | $90,000 | This tornado touched down in central Roberts County, roughly seven miles to the southeast of Highway 70, to the south of Farm to Market Road 283. The initial touchdown location and time were estimated based on a combination of radar imagery and storm spotter reports. This tornado grew in size very quickly, with several reports of it taking on a cone and stovepipe shape to it. As the tornado tracked to the southeast, it traversed very rugged terrain which did not provide much in the way of damage indicators or survey access. The highest concentration of visual and known damage was along FM 283 near the intersection with FM 2699. Here, there was minor branch and tree damage, but the more significant damage was a center pivot was completely overturned. It also appeared that some part of it was twisted. Given the angle of the pivot to the direction of motion as well as the presence of winter wheat in the field, it is probable that it took a higher wind speed to flip this pivot and this is one place where the highest rating occurred, somewhere between 105-110mph. The tornado then continued to the southeast, crossing FM 283 a few times. Along FM 283, near Quarter Horse Road, the tornado downed a power pole and twisted barbed wire fencing. Additional large branches were blown in this area. As the tornado once again crossed FM 283 south of Quarter Horse Road, it downed nine additional power poles. All along its track, surveyors noted several traffic warning signs bent over at the base and even some were broken and twisted at the base, and from the ground. The tornado traveled just to the north of Miami, with no known damage to the town. Storm spotters indicated it crossed Highway 60 before dissipating. Little damage was noted but the ending point was depicted on the south side of the highway per visual confirmation. The maximum estimated wind speed was 110mph. |
| May 2002 | Tornado (F1) | Miami | $65,000 | Two homes received moderate damage from the tornado while several storage sheds and a detached garage were completely destroyed. A few trees were snapped and numerous power poles were downed. No injuries or deaths were reported. One person whose home was struck by the tornado took shelter in the basement. |
| July 2002 | Thunderstorm Wind | Miami | $65,000 | Power poles were reported blown down and damage occurred to an irrigation system near the Farm to Market Road 2391 and 282 junction. |
| April 1997 | Thunderstorm Wind | Miami | $50,000 | Damage to 2 homes. |
| March 2007 | Thunderstorm Wind | Miami | $43,000 | An office building was overturned and a semi tractor trailer was flipped on its side. No injuries were reported. |
| May 2002 | Hail | Miami | $40,000 | Golfball to tea cup size hail caused considerable damage to vehicles...windows and roofs. |
| May 2002 | Thunderstorm Wind | Miami | $30,000 | Damaging downburst thunderstorm winds blew down trees...antennas...and removed roof shingles. |
| April 1972 | Tornado (F1) | not stated | $25,000 | no account filed |
| October 1971 | Tornado (F1) | not stated | $25,000 | no account filed |
| June 2007 | Thunderstorm Wind | Miami | $24,000 | Damage was reported at a lumberyard in the town of Miami. The damage was to an east facing lumber shed which was not open faced...but was also empty at the time. The roof was lifted off the shed which blew into power poles immediately west of the shed. The power poles were knocked down which hit a small power station causing power outages for a while throughout the town. No injuries or fatalities were reported. |
| September 2025 | Hail | Miami | $10,000 | Golfball to tennis ball sized hail fell. |
| May 2002 | Thunderstorm Wind | Miami | $8,000 | Numerous trees and powerlines were reported down along U.S. Highway 60 northeast of Miami. |
| May 2003 | Hail | Codman | $5,000 | no account filed |
| June 1994 | Hail | Miami | $5,000 | no account filed |
| May 2007 | Hail | Miami | $3,000 | Hail dented a vehicle in extreme northwestern Roberts County. |
| May 2024 | Hail | Miami | $3,000 | no account filed |
| May 1957 | Tornado (F2) | not stated | $2,500 | no account filed |
| May 2009 | Hail | Codman | $1,500 | The large hail broke the windshield of a vehicle. |
| April 2025 | Flash Flood | Codman | $1,000 | At least four to five inches of flowing water occurred across the intersection of FM2391 and County Line Road. |
| June 2025 | Thunderstorm Wind | Miami | $800 | A large healthy tree branch snapped. |
| May 1982 | Tornado (F0) | not stated | $30 | no account filed |
| May 1982 | Tornado (F1) | not stated | $30 | no account filed |
| June 2024 | Thunderstorm Wind | Miami | - | Large healthy tree were snapped at base along HWY 70 near Chicken Creek, north of Pampa. |
| July 2023 | Thunderstorm Wind | Codman | - | The Mesa Vista AWOS measured 58 mph wind gust from heat burst due to a nearby decaying thunderstorm. |
| May 2022 | Thunderstorm Wind | Miami | - | Carport pushed over and metal outbuilding damaged. |
| March 2021 | Thunderstorm Wind | Codman | - | Law enforecement reported an overturned semi on U.S. Highway 70 near Antelope Road. |
| May 2021 | Hail | Codman | - | Hail was accumulating on HWY 70. |
| May 2021 | Hail | Miami | - | Spotter reported penny to quarter size hail. |
| March 2021 | Thunderstorm Wind | Miami | - | Measured with weather instrument attached to storm chasers vehicle. |
| August 2021 | Hail | Codman | - | This report was received over social media. The hail lasted about 20 seconds. |
| August 2021 | Thunderstorm Wind | Codman | - | Spotter estimates a 60 mph gust with trees bending nearly 90 degrees. |
| May 2020 | Hail | Miami | - | Wind-driven hail up to golf ball size blew out windows on north and west facing walls of a home and vehicles. This event occurred 20 miles southwest of Wolf Creek Park. |
| May 2020 | Thunderstorm Wind | Miami | - | A small old wooden barn was destroyed. Sections of sheet metal were stripped off a larger barn. Several large tree limbs were broken. Several free-standing old fence posts were snapped. A large horse trailer (28 feet long) which included living quarters was flipped and pushed 8 feet. This event occurred 20 miles southwest of Wolf Creek Park. |
| August 2020 | Hail | Codman | - | A trained spotter reported dime size hail. |
| November 2020 | Hail | Miami | - | Sheriff's office reported golf ball size hail with damage to vehicles. |
| June 2019 | Thunderstorm Wind | Codman | - | A few broken windows were caused by wind and flying debris at a residence. |
| July 2019 | Hail | Miami | - | Spotter noted that not much hail had fallen but the stones that he could see were the size of nickels and quarters. |
| July 2019 | Thunderstorm Wind | Lora | - | Large tree blown down onto US Highway 60 at 5 Mile Park east of Miami. |
| May 2019 | Thunderstorm Wind | Miami | - | Broadcast Media received a report of 59 mph wind gust from the Robert Clark Ranch. |
| May 2019 | Tornado (EFU) | Codman | - | A rather large tornado occurred with a supercell storm as it moved west of Miami, TX. Pictures show the tornado was a large wedge around 850 pm, but no damage was found or reported as it remained in open country. |
| May 2019 | Hail | Miami | - | Delayed report with picture, time estimated from radar. |
| May 2019 | Hail | Codman | - | Delayed report. |
| May 2019 | Tornado (EF2) | Lora | - | The tornado touched down in northern Roberts County around 659 pm CDT, crossed the Roberts/Ochiltree county line around 704 pm CDT and the Ochiltree/Lipscomb county line around 719 pm CDT before dissipating through a rope out process by 733 pm CDT. Damage from the tornado consisted mostly of damage to trees, power lines and |oil/natural gas field equipment and sheds. There was also two manufactured homes being transported via truck the were blown off Highway 83. The tornado was noted to be larger and possibly stronger in inaccessible open county to the southwest of|the location where it was measured to be around 1/2 mile wide and rated an EF2 by the survey team. |
| May 2019 | Tornado (EF0) | Codman | - | Weak tornado observed on live chaser feed. No damage occurred. |
| September 2019 | Thunderstorm Wind | Miami | - | A large tree branch 4 to 6 inches in diameter was blown down. In addition, the roof was blown off a barn. This damage occurred in the southwest part of Miami. |
| May 2019 | Thunderstorm Wind | Miami | - | Late report of 70 mph thunderstorm wind gust. Some tree limbs were taken down as a result. |
| May 2019 | Tornado (EF1) | Codman | - | NWS storm surveyed a tornado which occurred 12 miles north of Pampa at 614 pm CDT before it lifted at 628 pm CDT 15 miles NNW of Codman. The tornado damaged powerlines north of Pampa, with a damage path that was over 9 miles long and 50 yards wide. Tornado was given an EF-1 rating. |
| June 2018 | Hail | Lora | - | Late report of quarter size hail and heavy rainfall with thunderstorm. |
| June 2018 | Thunderstorm Wind | Codman | - | Trees blown over, outbuildings destroyed and irrigation systems blown over near intersection of FM 282 and FM 2391. |
| June 2018 | Thunderstorm Wind | Miami | - | Late report from a spotter. |
| May 2018 | Hail | Codman | - | Mping report. |
| May 2018 | Hail | Miami | - | Late report from county sheriff of hail damaged vehicles due to hail the size of hen eggs. Time estimated from radar. |
| May 2018 | Hail | Miami | - | Late report of quarter sized hail. |
| May 2018 | Hail | Miami | - | Hail ranging from dime to quarter size. |
| October 2017 | Thunderstorm Wind | Miami | - | Post event report spotter estimated winds to be around 50 gusting 60-65. There were tree limbs down one 3 to 4 inches in diameter. |
| May 2016 | Hail | Miami | - | Quarter to half dollar size hail accumulated on Highway 60. |
Named settlements recorded in the Geographic Names Information System, each with the topographic sheets covering it. Villages, hamlets and abandoned places alike. Each is shown with the nearest named watercourse or landform and the survey quadrangle it falls on.
Miami census division · 79059 · Dry Creek NE quadrangle
5 sheets, 1954 to 1982
No longer a settlement
The vanished settlements of Roberts County: the places named above that are no longer on the map.