 Block
BlockFrom the record
2 National Register listings published here.
Sources: the National Register database, National Park Service
47 topographic sheets cover 27 settlements here, and 2 properties are on the National Register of Historic Places.
2 National Register listings published here.
Sources: the National Register database, National Park Service
Every property in this county listed on the National Register of Historic Places, with the year it was listed and the federal nomination document.
| Photograph | Property | Type | Listed | Reference |
|---|---|---|---|---|
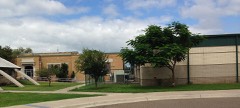 | Old Lyford High School | building | 1985 | 85002770 |
 | Willacy County Courthouse | building | 2017 | 100000507 |
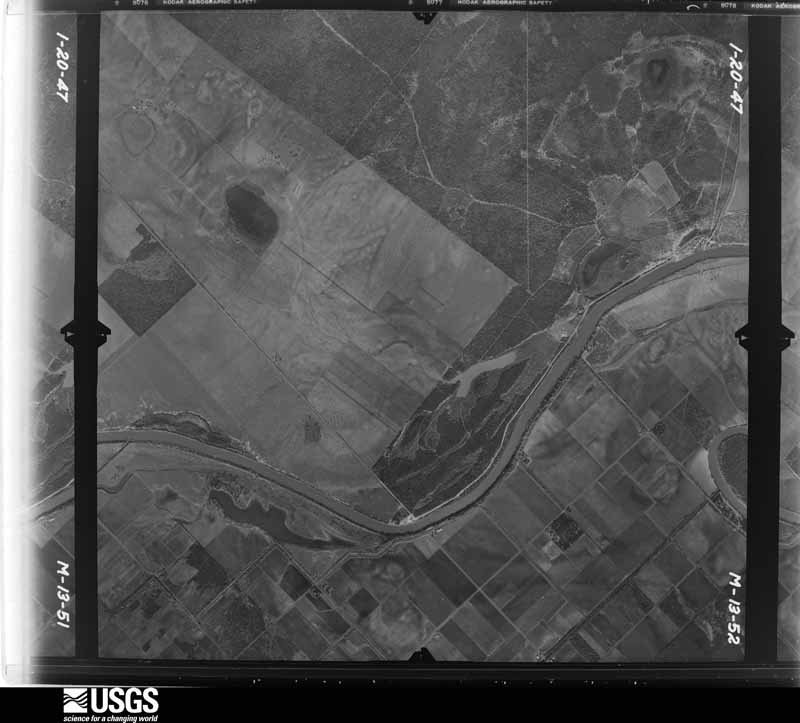
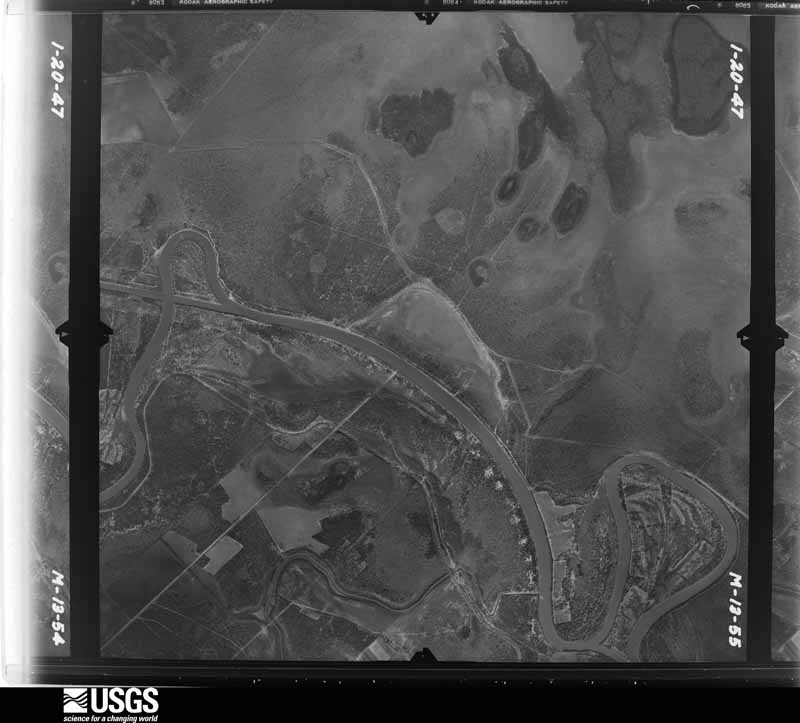
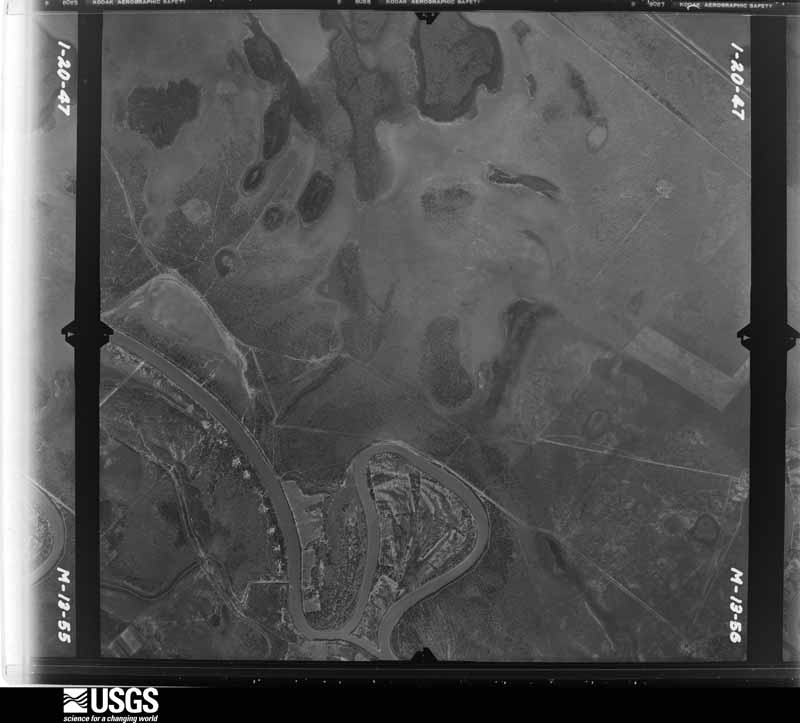
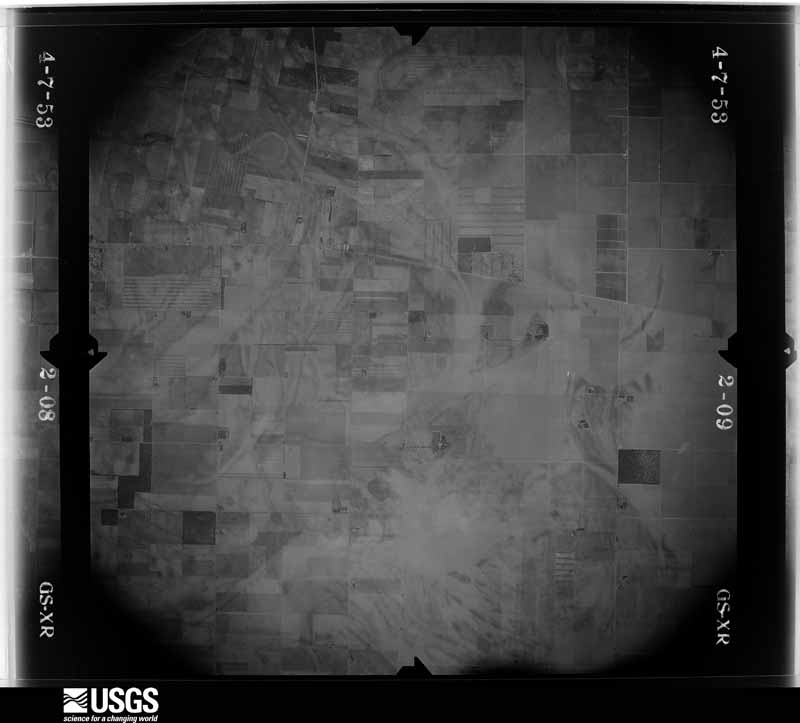
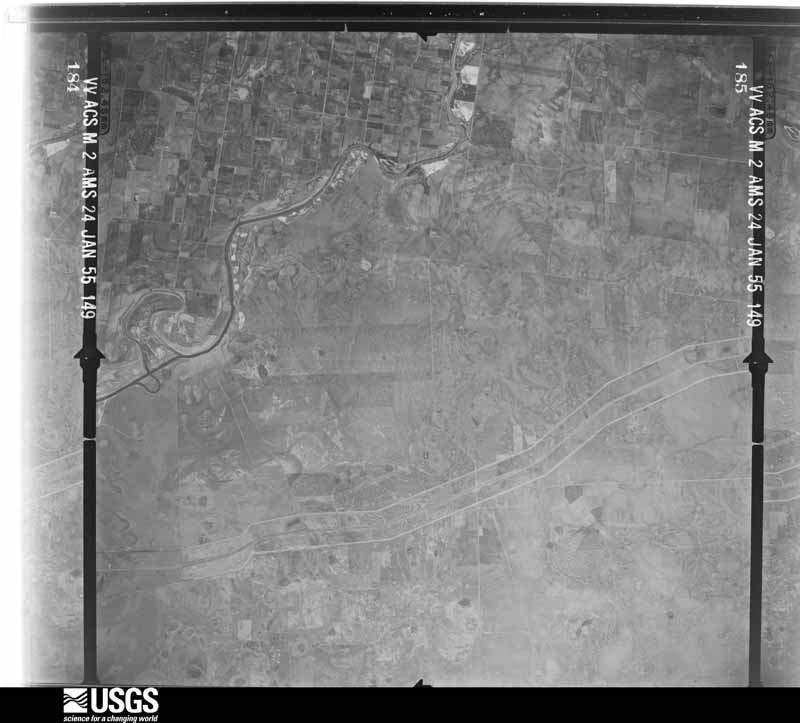
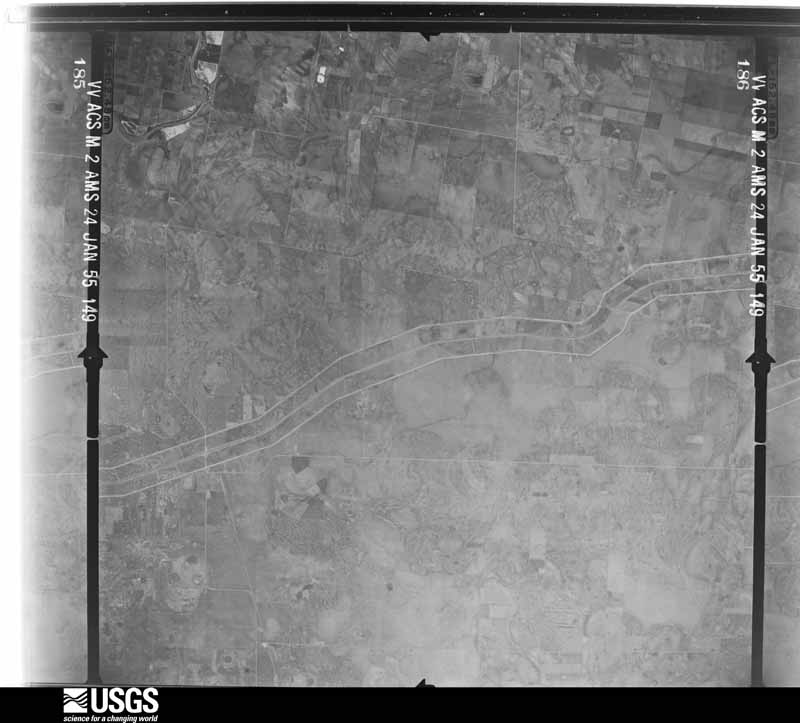
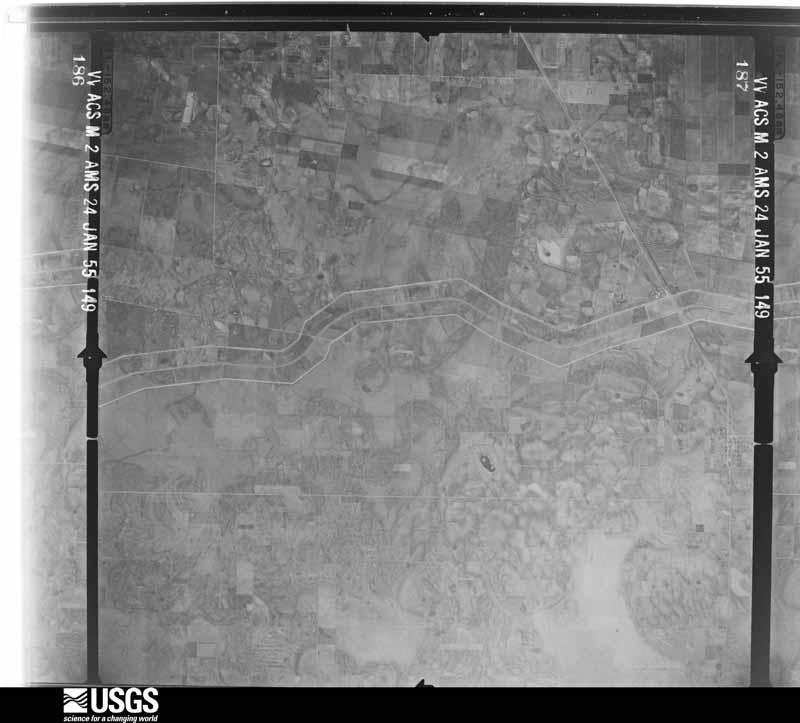
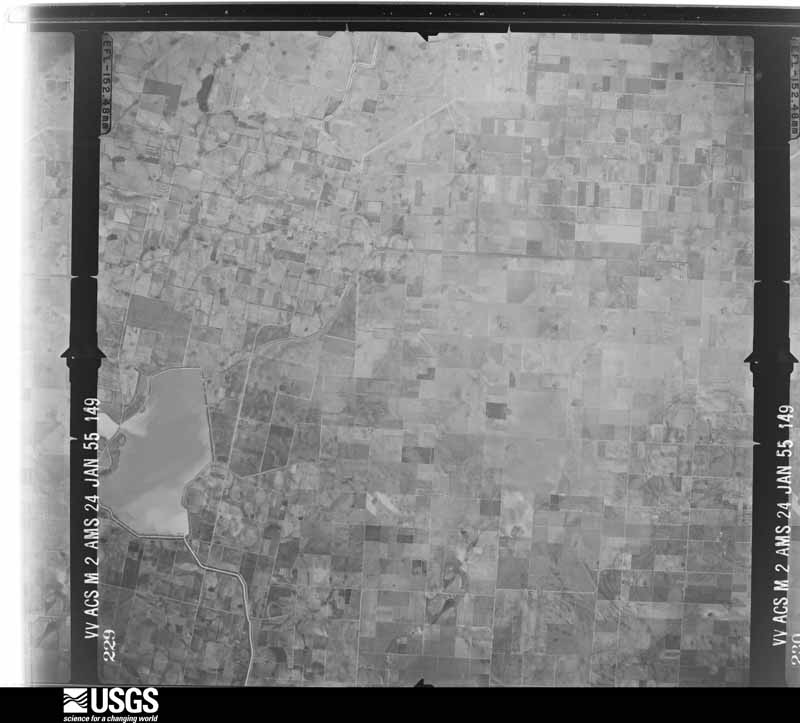
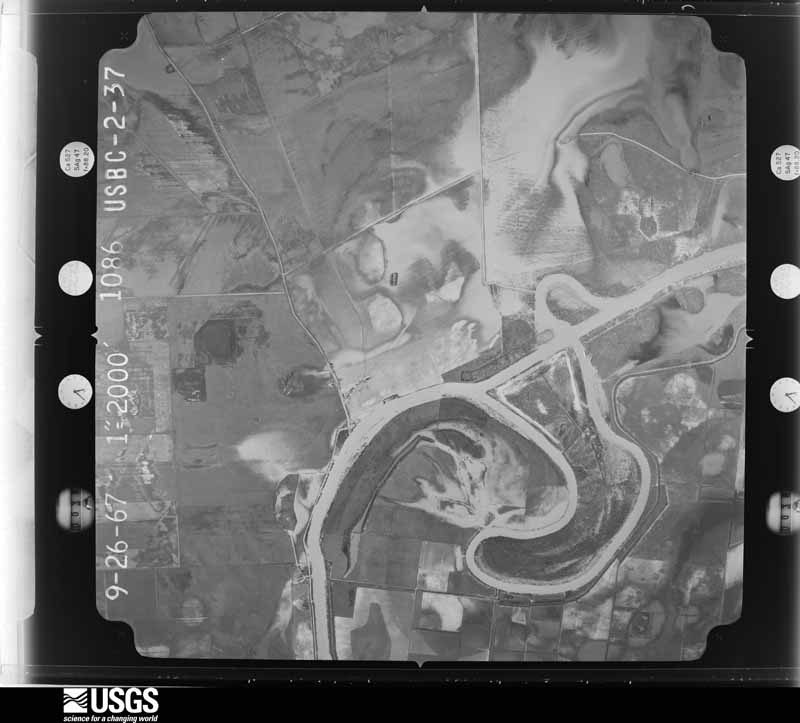
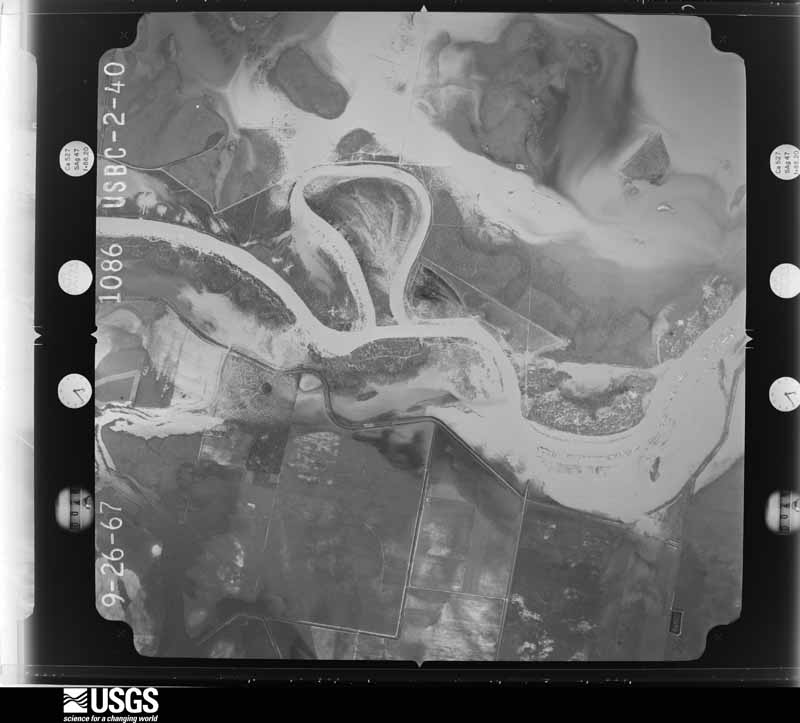
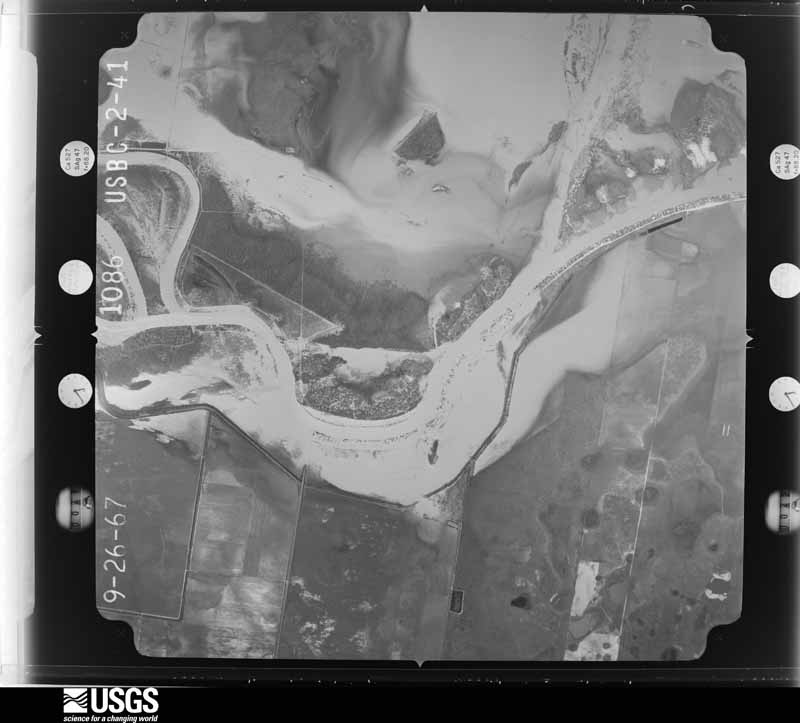
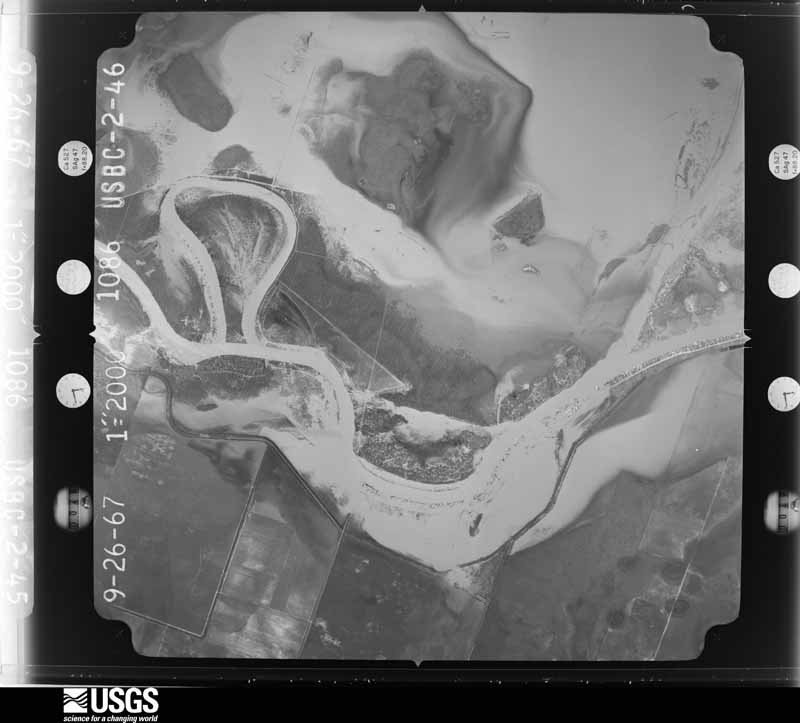
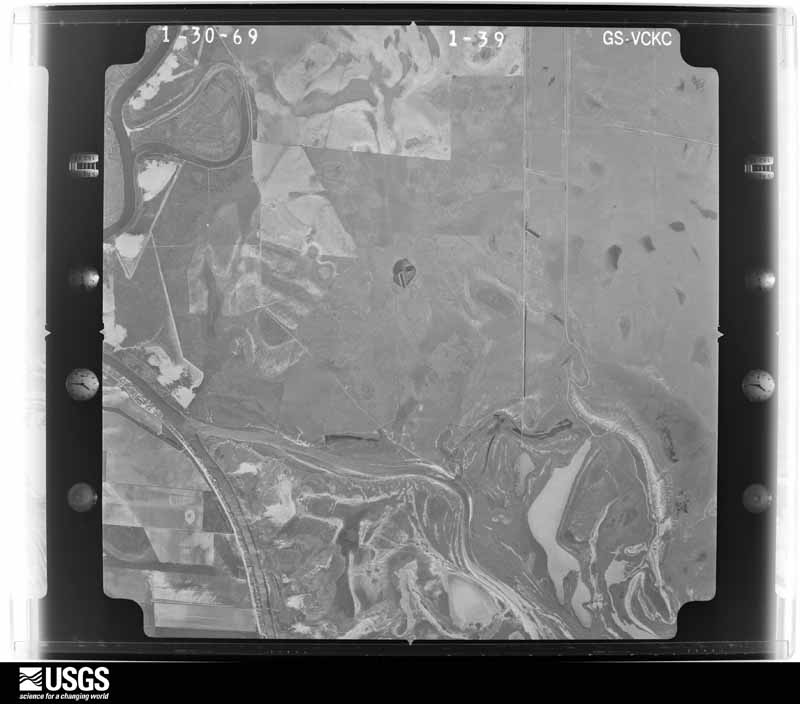
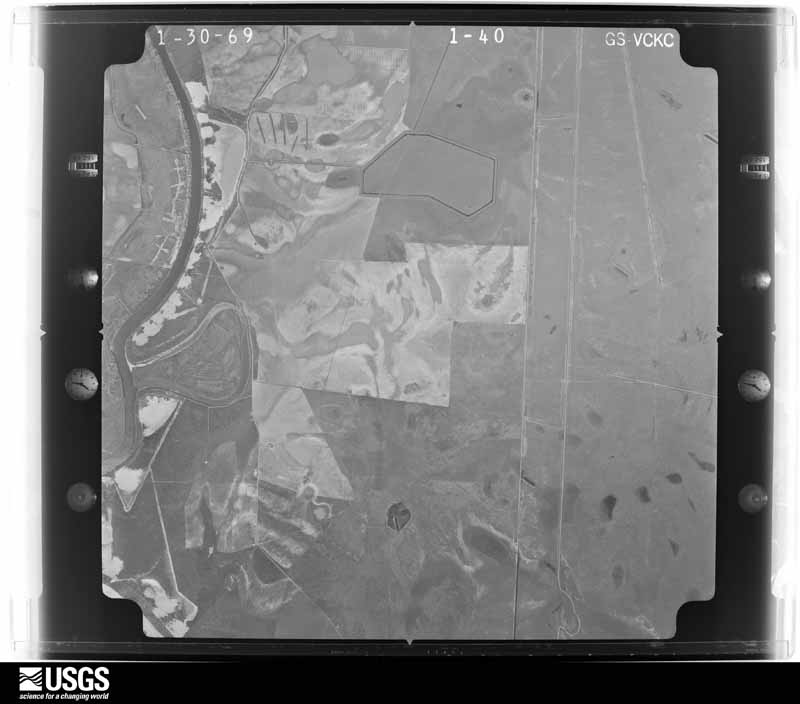
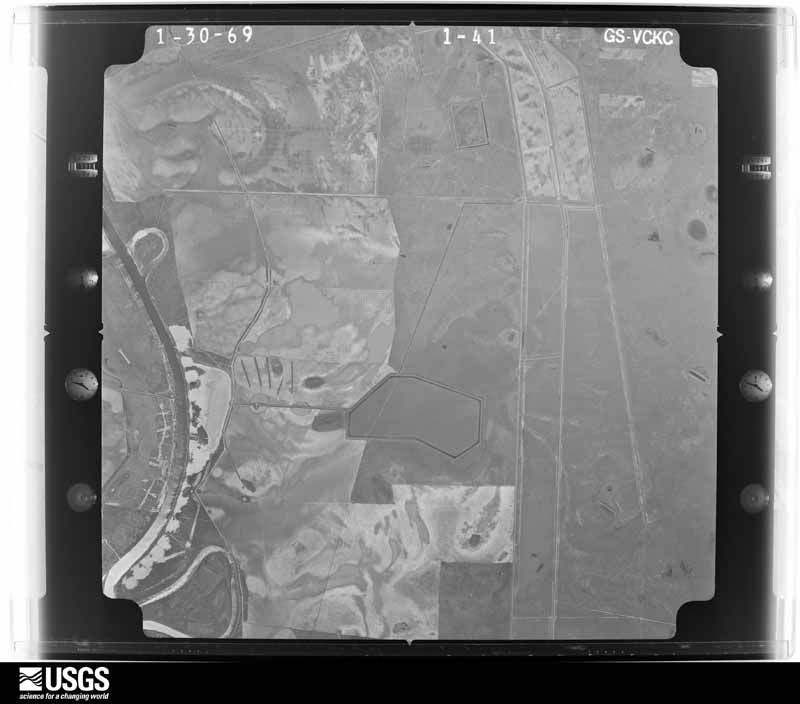
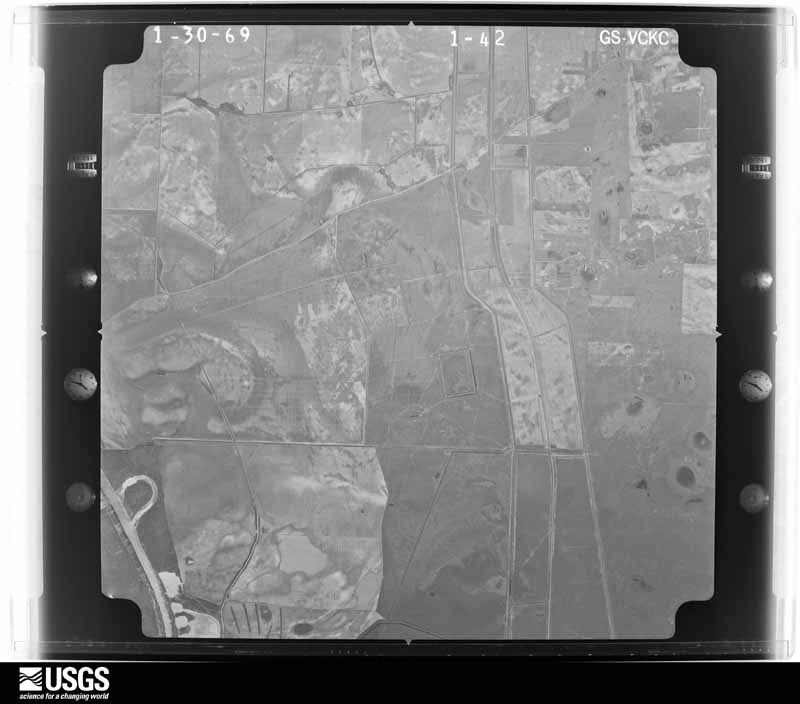
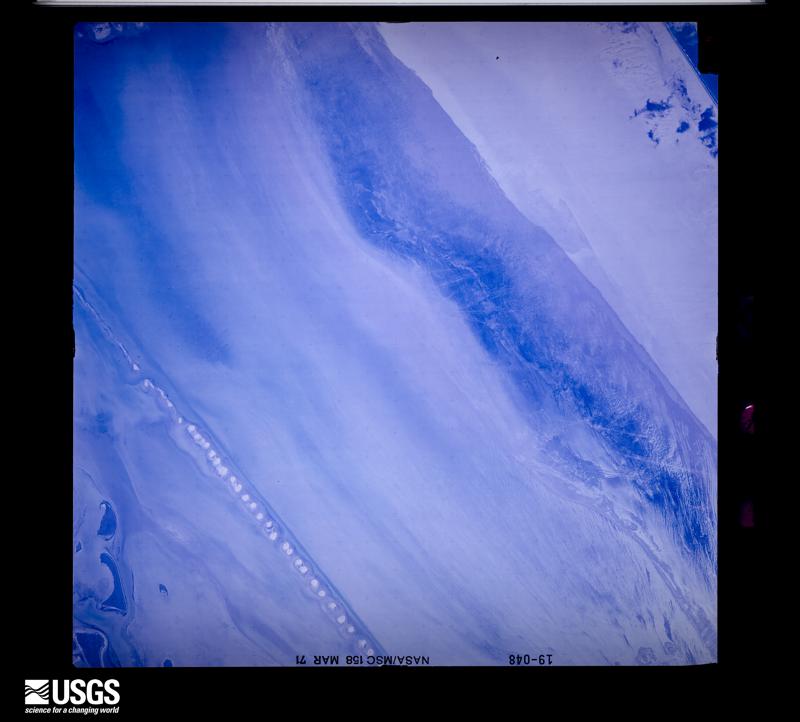
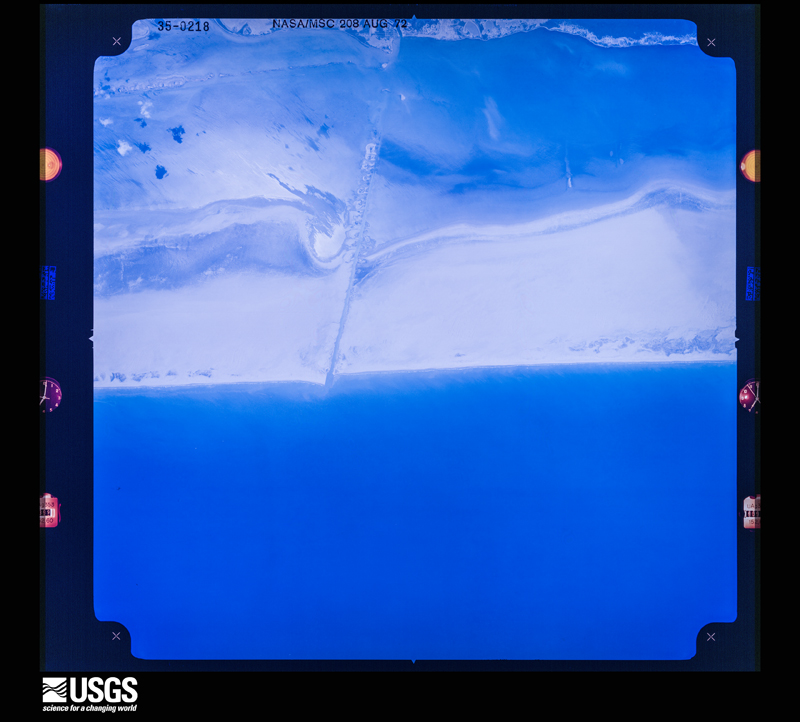
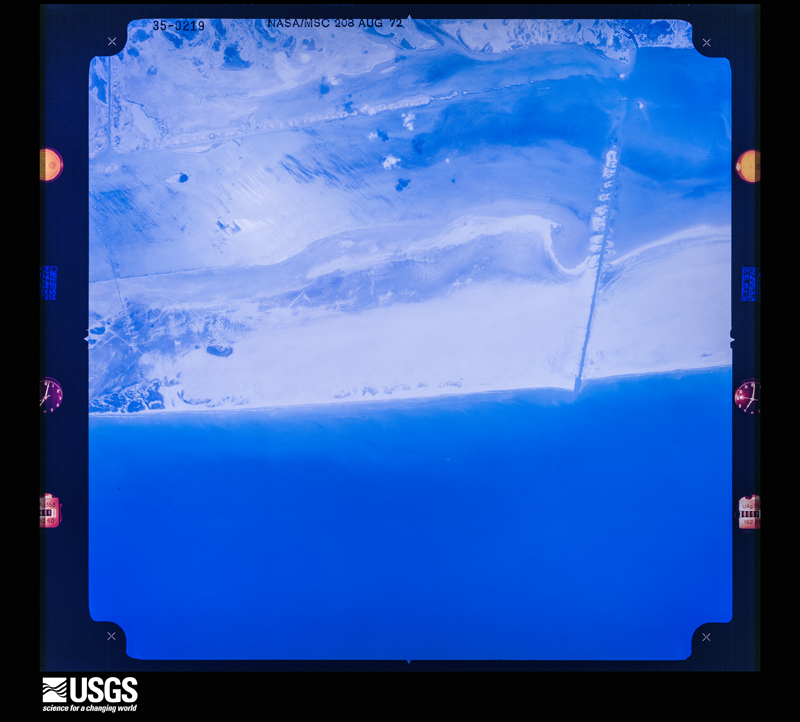
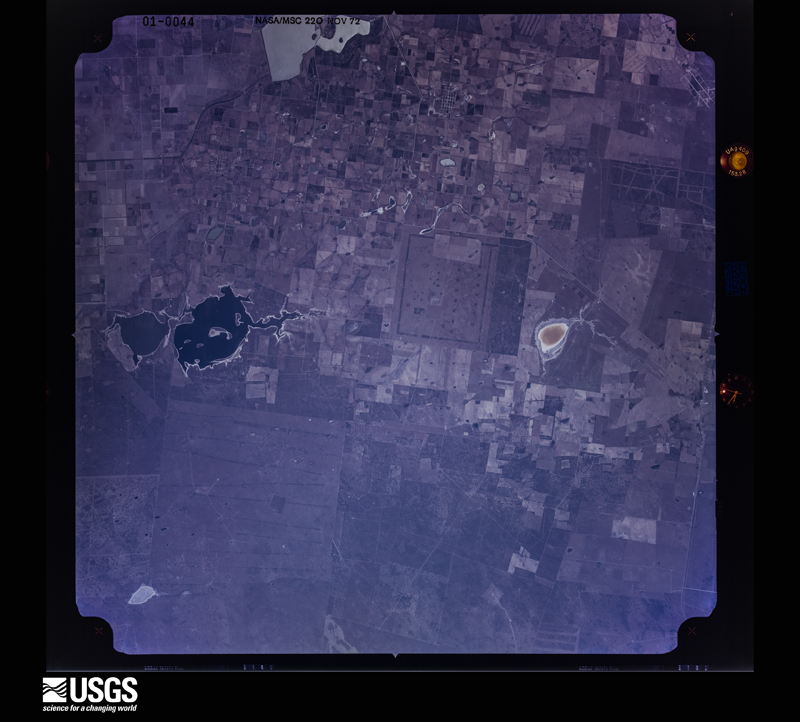
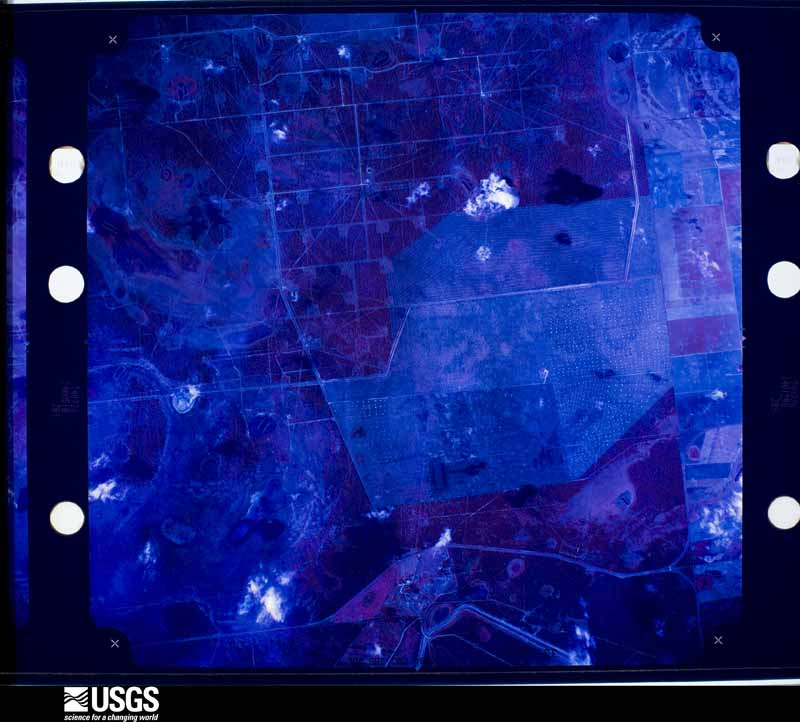
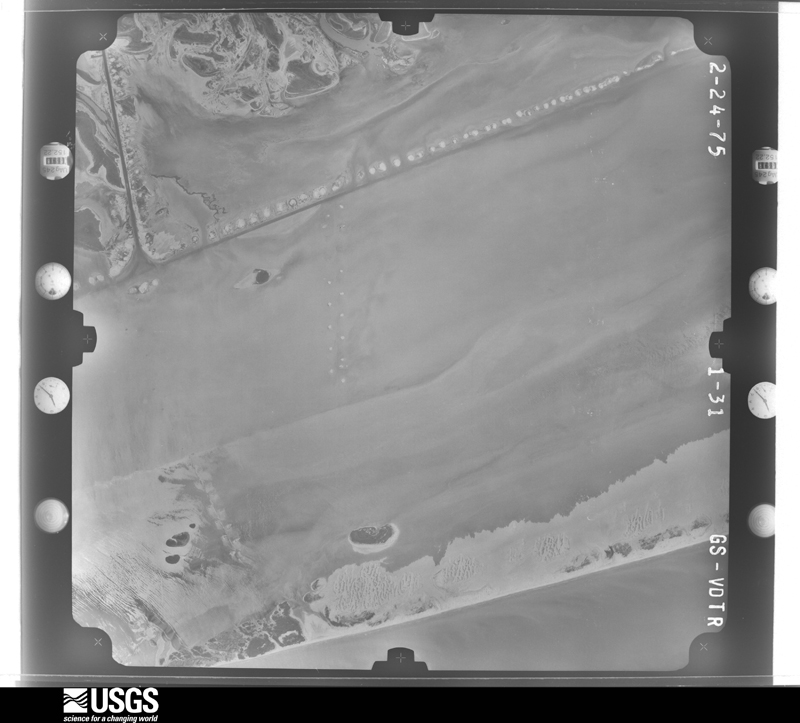
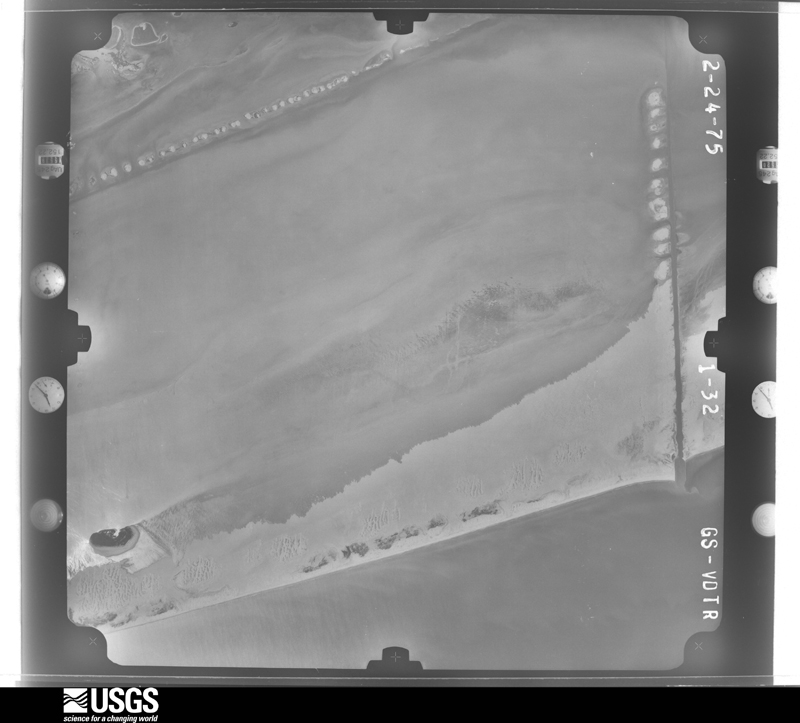
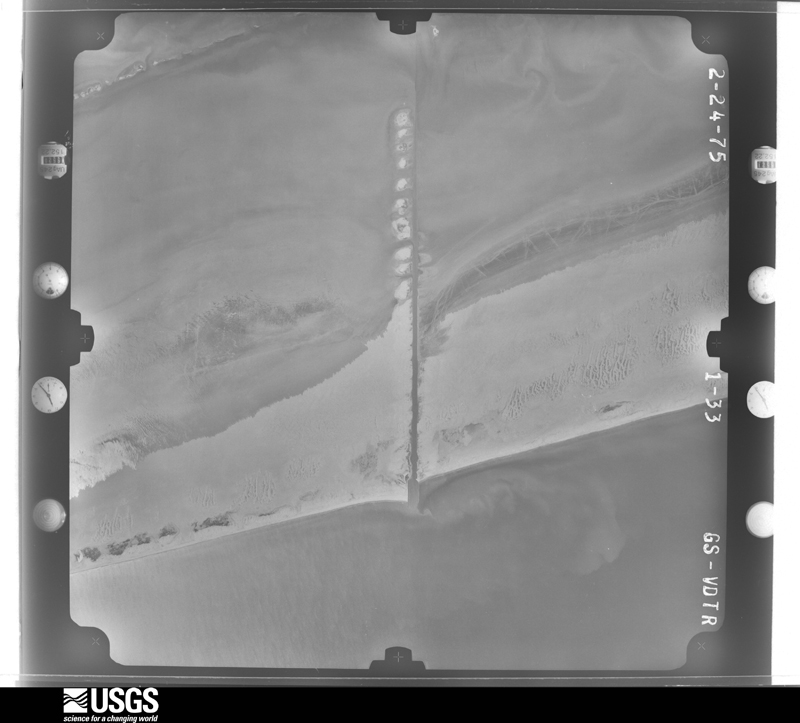
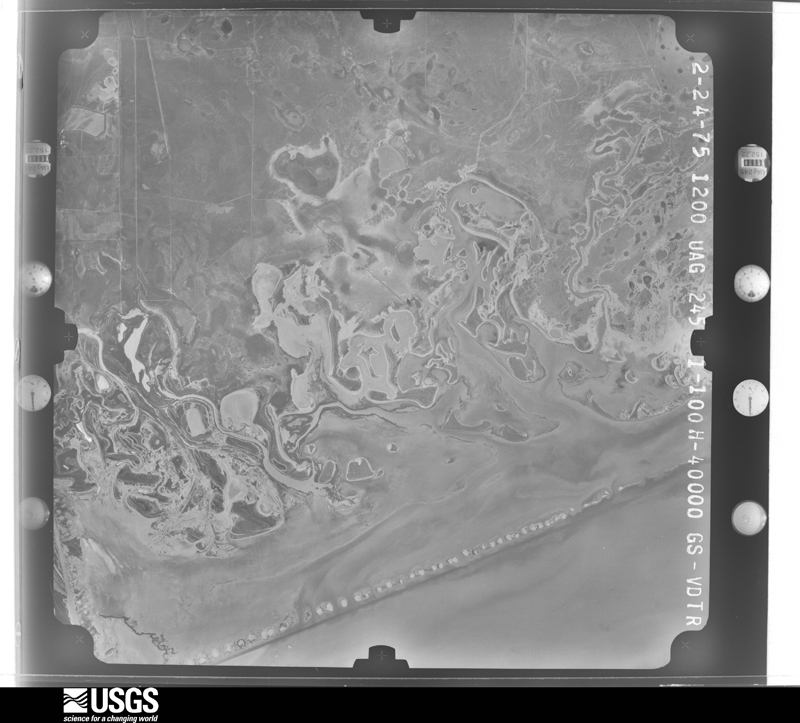
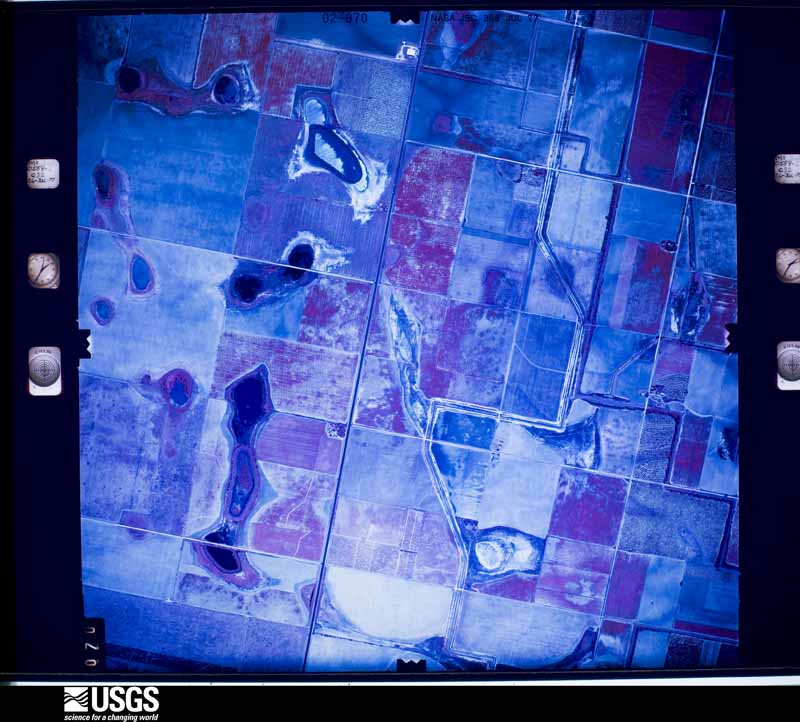
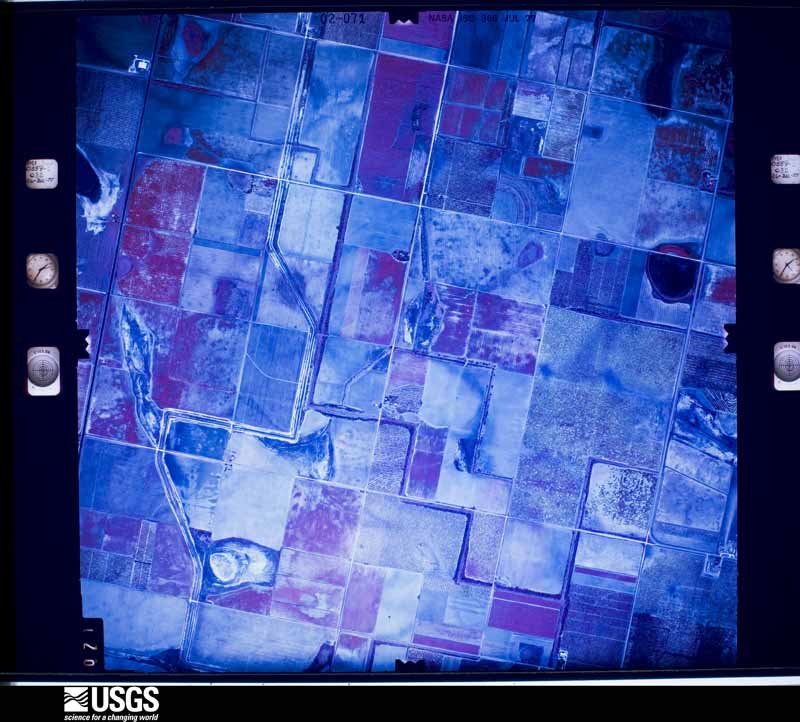
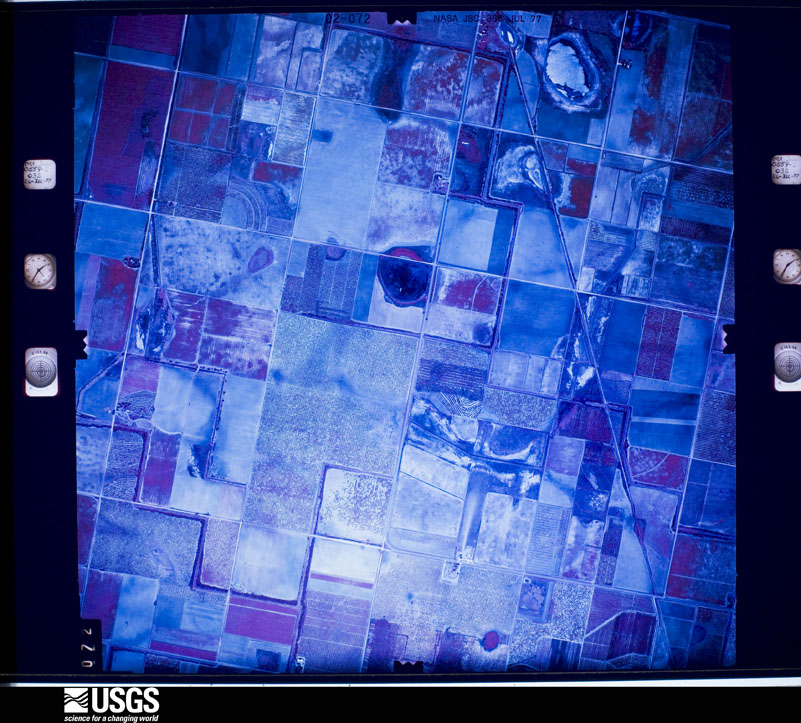
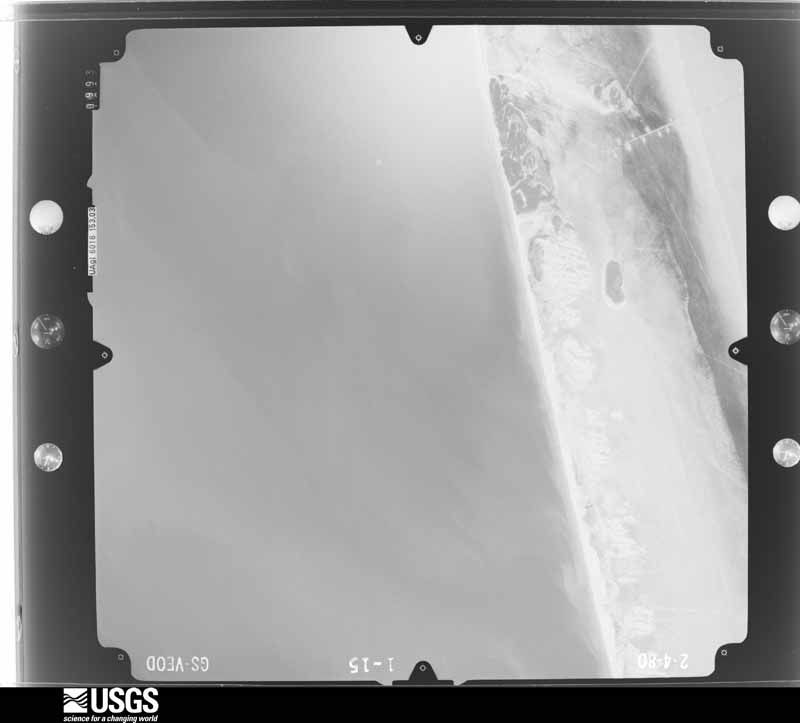
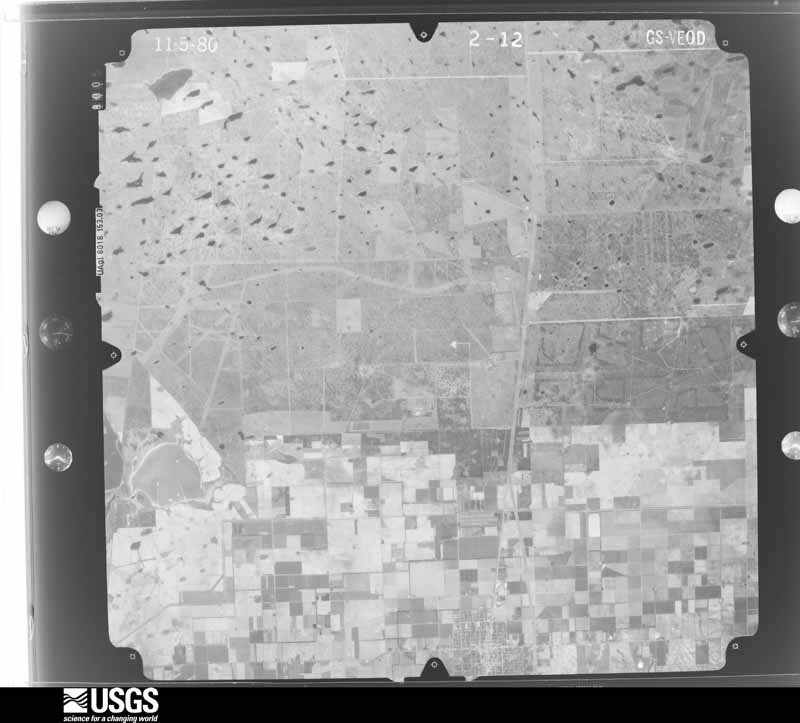
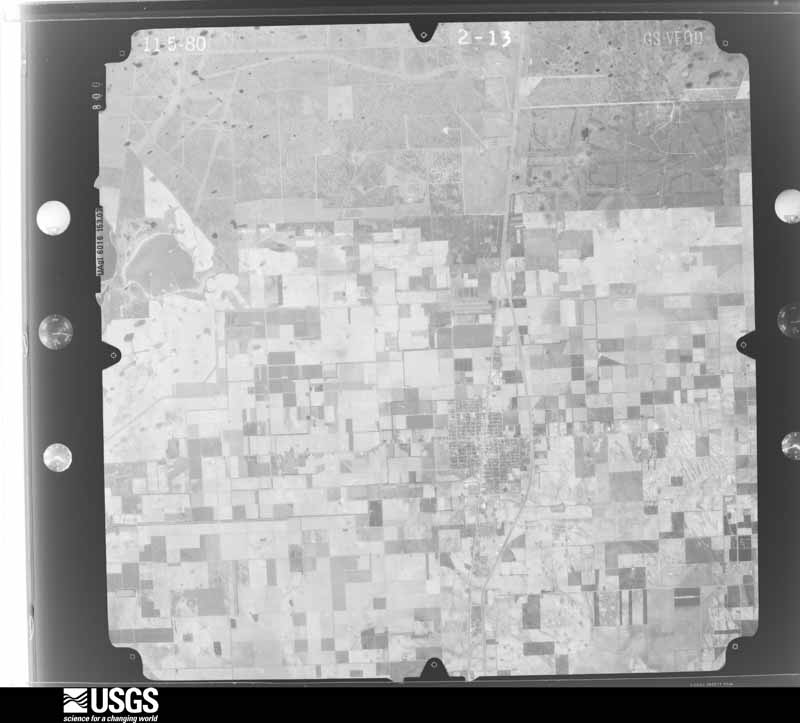
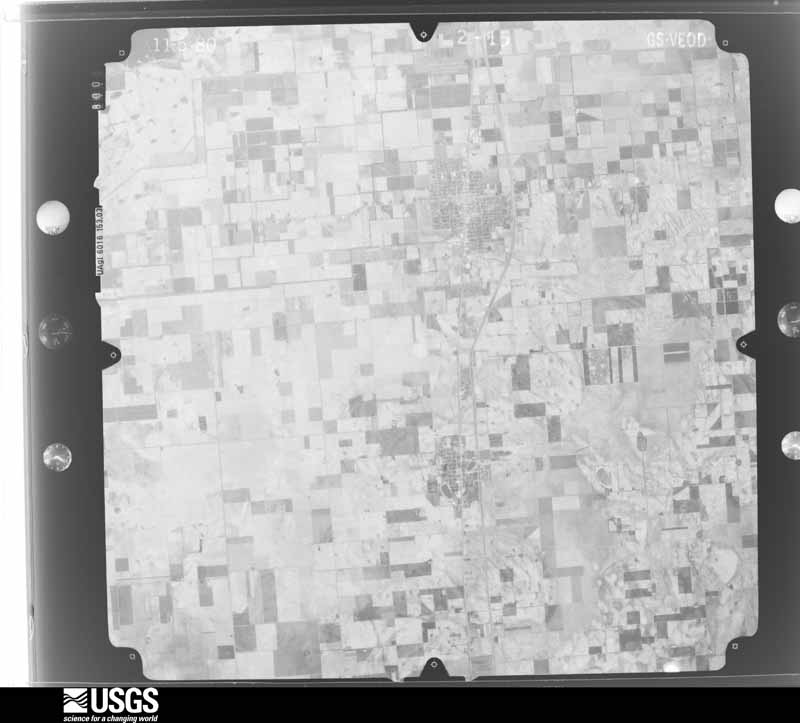
Flown by the U.S. Geological Survey between 1937 and 1989, the Aerial Photo Single Frames collection is the definitive mid-century view of the land: fields, roads and rivers as the camera saw them. The Survey holds 1,312 frames inside the rectangle that bounds this county; the 48 frames below were taken over the county itself, chosen across the decades of flights (at most four a year from that rectangle), so one flight cannot crowd out the rest. The full set is free to browse and download at EarthExplorer under the dataset Aerial Photo Single Frames.
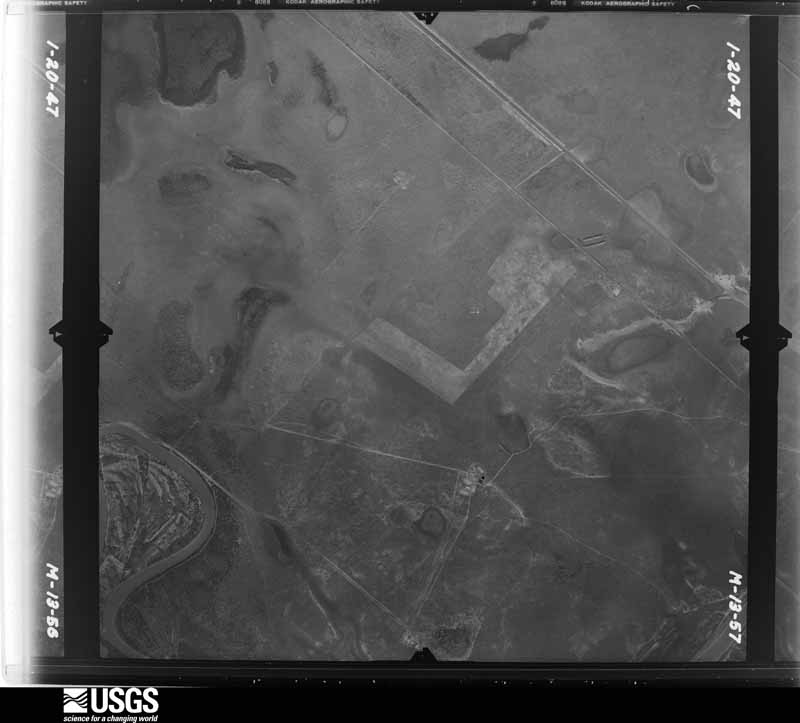
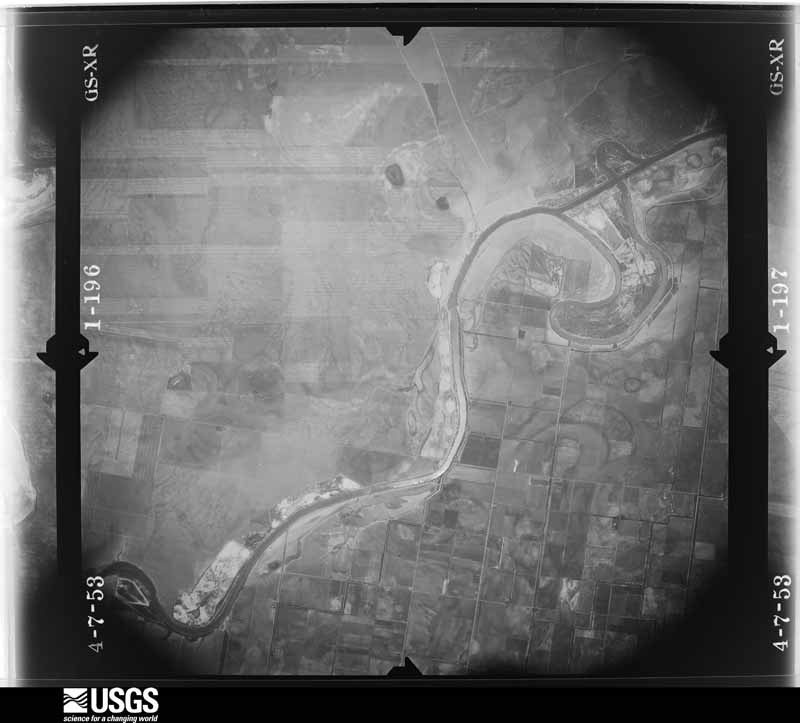
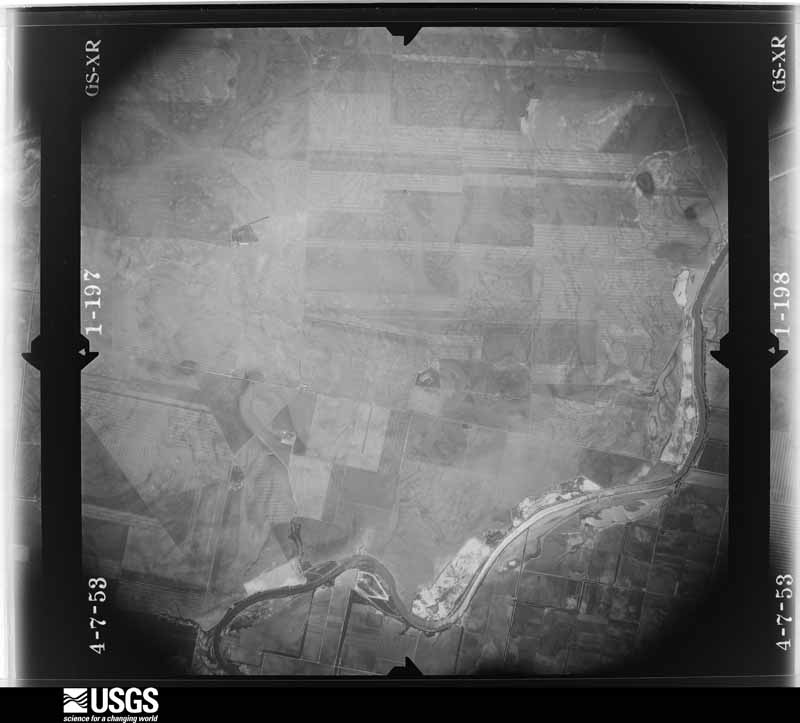
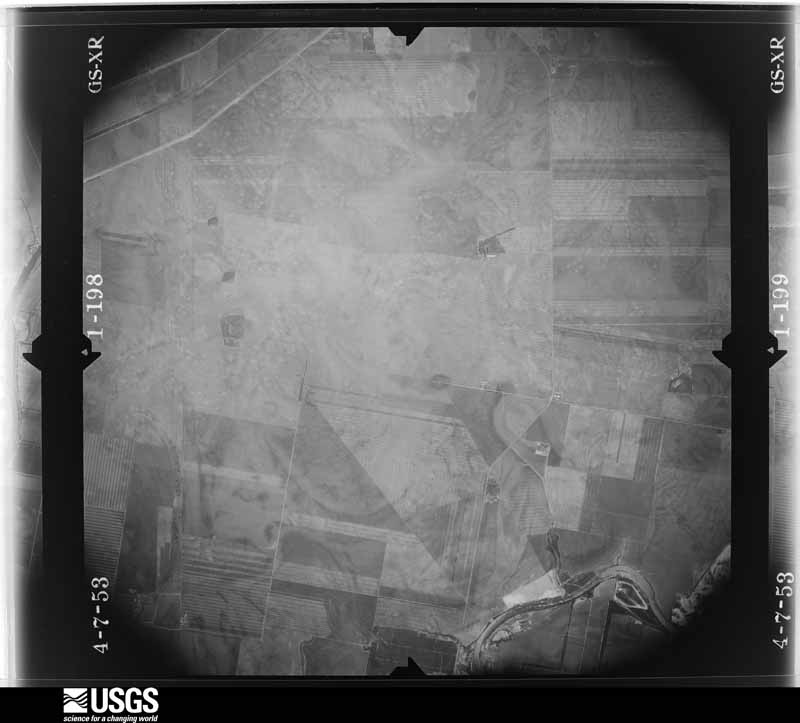




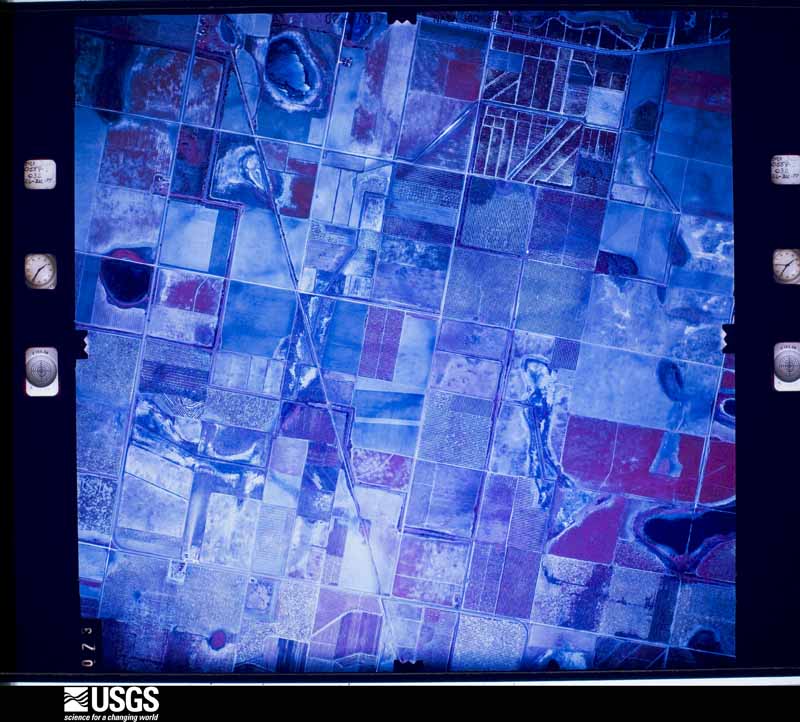
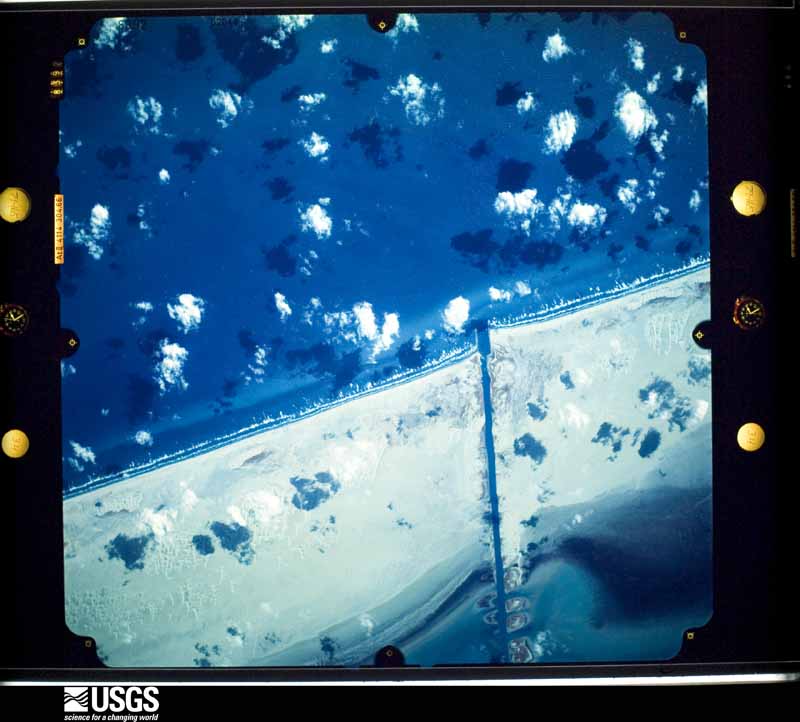
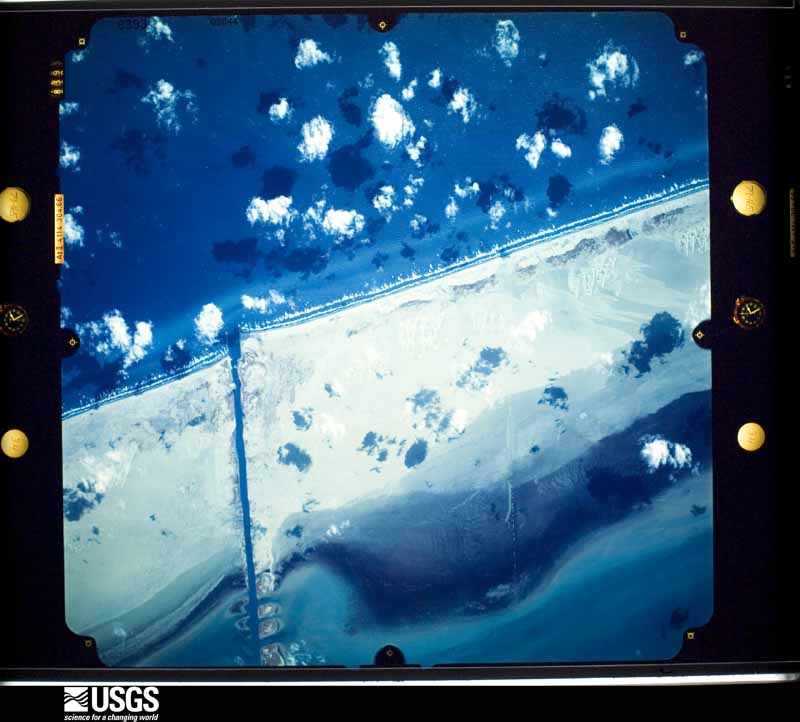
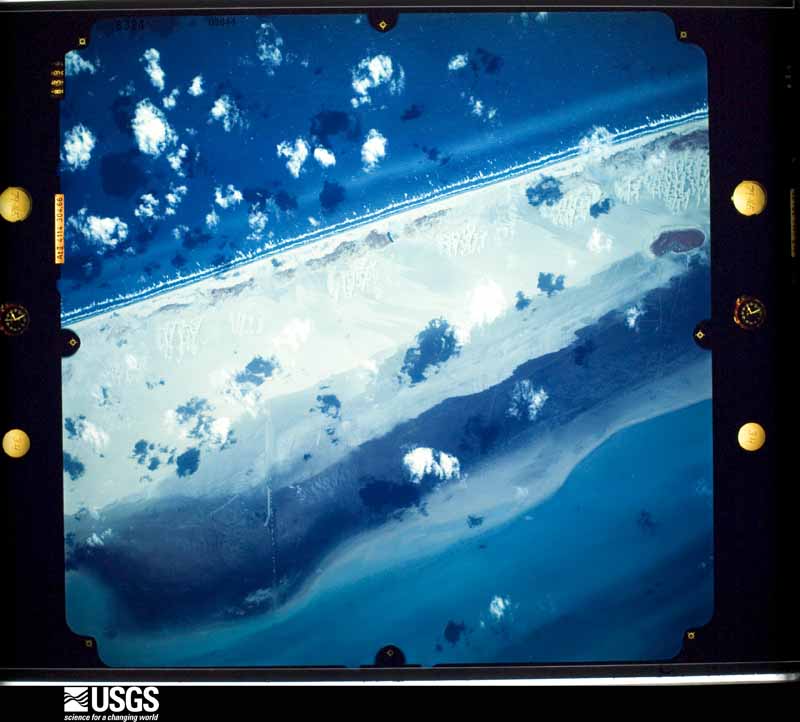

The thermometers that kept this county's weather, as the federal records hold them. The extremes below are measured values from those records, not estimates.
Who lived here in 1950, one enumeration district at a time, as the Census Bureau described each district. Each row opens its official National Archives result, with Population Schedules and ED Maps available there.
Every wildfire the federal occurrence database records inside this county: 184 of them, burning about 5,176 acres. 3 started naturally and 21 were recorded as arson. Each settlement page carries the fires within five miles of it.
| Reported cause | Fires |
|---|---|
| Missing data/not specified/undetermined | 84 |
| Debris and open burning | 62 |
| Arson/incendiarism | 21 |
| Equipment and vehicle use | 6 |
| Power generation/transmission/distribution | 5 |
| Smoking | 3 |
| Natural | 3 |
The five largest, by the area the report gives. Two of them were set deliberately.
| Date | Cause | Size | Reported by | Name on the report |
|---|---|---|---|---|
| 8 February 2011 | Missing data/not specified/undetermined | 1,000 acres | Texas A & M Forest Service | GRASS FIRE |
| 20 February 2011 | Missing data/not specified/undetermined | 1,000 acres | Texas A & M Forest Service | FOREST/WILDLAND FIRE |
| 17 June 2012 | Missing data/not specified/undetermined | 400 acres | Texas A & M Forest Service | WILDLAND FIRE |
| 12 September 2011 | Arson/incendiarism | 300 acres | Lower Rio Grande Valley National Wildlife Refuge | TENIENTE 3 |
| 30 March 2010 | Smoking | 255 acres | Texas A & M Forest Service | BOYINGTON-FIRE |
| 11 January 2012 | Power generation/transmission/distribution | 200 acres | Texas A & M Forest Service | BRUSH FIRE |
| 3 February 2006 | Equipment and vehicle use | 150 acres | South Texas Refuge Complex | YTURRIA RANCH COMPLEX |
| 12 September 2011 | Arson/incendiarism | 105 acres | Lower Rio Grande Valley National Wildlife Refuge | TENIENTE 2 |
Every settlement page carries the fires within five miles of it - see the settlement index below.
The NOAA Storm Events Database holds 166 reports for this county, causing 3 deaths, 3 injuries and about $35,561,500 in recorded property damage. Each settlement page carries the reports that name it.
| Kind of event | Reports |
|---|---|
| Thunderstorm Wind | 52 |
| Hail | 44 |
| Flash Flood | 24 |
| Tornado | 22 |
| Flood | 13 |
| Heavy Rain | 7 |
| Lightning | 3 |
| Funnel Cloud | 1 |
The most serious of them, by death, then injury, then recorded damage. The accounts are quoted exactly as the forecast office filed them.
| When | Event | Place named | Harm | What the report says |
|---|---|---|---|---|
| March 2025 | Lightning | Sebastian | 2 killed, $20,000 | The Cameron County Office of Emergency Management reported a trailer home struck by lightning with the entire building consumed by the flames after the pre-dawn strike. Two residents inside were killed by the ensuing fire. |
| June 1988 | Thunderstorm Wind | not stated | 1 killed | no account filed |
| October 2015 | Tornado (EF0) | Porfirio | 1 hurt, $50,000 | The survey team estimated peak winds between 70 and 75 mph for the Willamar tornado. Primary damage was a cotton seed container/holder that was lifted from moorings into concrete block. The lack of material in the metal container allowed winds to get underneath and lift; pressures on the minimally anchored columns caused the damage. Other damage included a portion of roof peeled back from a mobile home, where a 12 year old child was injured by flying debris and taken to a local hospital in Harlingen for observation. The tin roof damage revealed poor connections to rotted wood. Minor damage to trees along Farm to Market Road 1420 was also noted. |
| May 1970 | Tornado (F2) | not stated | 1 hurt, $25,000 | no account filed |
| June 1962 | Tornado (F2) | not stated | 1 hurt | no account filed |
| June 2019 | Flash Flood | Yturria | $15,000,000 | Measured and estimated rainfall between 8 and 12 or more inches that fell predominantly from early evening June 24th through a bit after midnight on June 25th produced widespread flash flooding across western Willacy County. Hardest hit locations were Sebastian, Lyford, Raymondville, and La Sara. ||In the tri-county area (western Willacy, northwestern Cameron, and southeastern Hidalgo), 1188 homes were considered destroyed or with major damage, with an additional 182 homes with minor damage. Hundreds of streets flooded, including 30 Texas-managed highways. This included the frontage roads of Interstate 2 and Interstate 69E. ||More than 100 persons were evacuated to higher ground when dozens of homes were threatened by 2 to 4 feet of water in each county; the entire western two thirds of Raymondville was under 1 to 3 feet of water; up to 4 feet was noted in LaSara during the peak of the heavy rain just before midnight on June 24th, and poor drainage flow in canals and ditches backed up water into Sebastian well after the rain had ended. |Individual Assistance costs for the affected area in the three counties was estimated at $27.6 million as of early August 2019; Public Assistance values were unknown but likely to add to the damage, which will be estimated at $75 million in all three counties. Daily rainfall records were set in the flood area, including 9.7 inches in Raymondville which shattered the prior daily record by nearly 8 inches on the date (prior was 1.83 inches in 1923) and set a new daily record for the month of June (prior was 6.23 in 1993), with records going back to 1910. ||Despite the flooding and damage, much which occurred in the dark, there were no know deaths of injuries directly attributed to the flood. |
| July 2020 | Flash Flood | Port Mansfield | $5,980,000 | Reports of high flowing water blocking passage along SR-186 just west of Port Mansfield were received during the evening of July 25th, when feeder bands into the eastern semicircle of then-Tropical Storm Hanna dropped an additional 4 to 8 inches of rainfall into central and eastern Willacy County. Other flooding was noted in poor drainage locations of Raymondville, and there was an unknown amount of field flooding in eastern Willacy County due to an estimated 11 to 13 inches of rainfall through the duration of the event, which began during the mid afternoon of July 25th. ||Water depths of 2 to 3 feet were likely in some areas, though specifics were unknown. A known poor drainage location at an apartment complex in south Raymondville had up to 3 feet of water depth in parking areas, blocking access to the facility. Other flood related damage in central Willacy County was minimal. In Port Mansfield, where nearly 15 inches of rain fell, including 9 inches in initial inner eyewall bands on July 25th, sandy soil and antecedent dry conditions kept flooding to a minimum. ||Crop damage from flooding rain was significant in Willacy County, including a heavy loss of cotton lint (or bolls) which were destroyed by the flood. Estimates suggest that $36 million in cotton crop was lost from Hanna's flooding rains.||Property damage from flood waters was calculated using NCEI's total dollar damage estimate (divided among the affected counties by local storm data experts). Total property damage from flood waters for Willacy County was $5.98 million. |
| June 2019 | Lightning | Willamar | $5,000,000 | A strong cloud to ground lightning bolt struck and set ablaze a wind turbine and tower at the Willacy County Los Vientos wind farm during the initial severe thunderstorm that impacted the county during the early evening of June 24, 2019. Another strike destroyed a small grain silo just to the west of Lyford and Raymondville. Time of the strike is estimated from peak lightning frequency, which exceeded 300 cloud to ground strikes in 15 minutes. |
| October 2015 | Flood | Sebastian | $2,500,000 | Hazardous, high water on roadways, in homes, and across cropland continued across nearly all of eastern Willacy County. |
| October 2015 | Flash Flood | Sebastian | $2,500,000 | The heavy rainfall on October 24th led to much of eastern Willacy County being under several feet of water. Water rescues were underway prior to the heaviest rains and continued through the afternoon. Though homes are few and far between (mainly farm houses or workers homes), the majority likely had water inside them by late in the day. Hazardous, high water was found across nearly all of the County east of the expressway (and the larger communities). |
| March 2012 | Flash Flood | Port Mansfield | $2,000,000 | Runoff from storms in Hidalgo County was moving so swiftly that it caused the collapse of a weir in Willacy County. Estimates for repair of the structure are around $2 million. |
| June 2018 | Flash Flood | Sebastian | $1,500,000 | The same clusters of thunderstorms that dropped between 12 and an estimated 18 inches in the Weslaco/Mercedes area early on June 20th dropped an estimated 5 to 10 inches on central through northeastern Willacy County (primary population areas), including a number of farm fields (agricultural damage unknown). Final damage totals from initial emergency management surveys of public damage were nearly three-quarter of a million dollars, with standard doubling estimating the value at just over $1.5 million. |
| October 2015 | Flash Flood | Willamar | $500,000 | More than three hours or torrential rain fell in and near the communities of San Perlita, Willamar, and Santa Monica. As the rain totals increased, the water piled up; FM 1420 was inundated by several inches to more than a foot of water (some flowing), and nearby farms turned into one big lake. Photos and anecdotal evidence suggested two to three feet in the fields during the peak of the storm and probably well into the overnight hours. |
| October 2015 | Tornado (EF1) | Willamar | $50,000 | A survey team revealed peak winds ranging from 74 to 86 mph for the Los Coyotes Tornado. The 86 mph winds were measured by a property owners weather station, whose information was considered viable based on visual evidence of damage and radar depiction of velocity in the core of the circulation, which exceeded 60 knots (70 mph). Damage in Los Coyotes was to a few barns and outbuildings, as well as uprooted and snapped trees. Emergency Management noted seven power poles were leaning or down, but had been repaired by the time to survey was conducted on October 31. |
| July 2010 | Flood | Sebastian | $50,000 | Incredible rainfall estimated to be more than 50 inches in around 10 days' time between June 30th and July 9th across the front range and peaks of the Sierra Madre Oriental in Coahuila Province, Mexico, ultimately flowed through the entire Lower Rio Grande basin for much of the summer of 2010. ||Nearly a month of dam releases from Falcon International Reservoir at 60,000 cfs ultimately required water to be diverted at Anzalduas Dam (southwest of Granjeno) into Mexico and the U.S. Floodway system, which includes the North Floodway which curves east across southeastern Willacy County between Sebastian and Santa Monica. ||These floodways, protected by a robust system of levees and gates, protected communities outside of the levees by containing up to 50%, or 4 to 8 to feet, of fast flowing water, within them. In Willacy County, there were no reports of structural damage. However, FM 507 and FM 1420, as well as several paved and unpaved county roads, were closed at low water crossings inside the levee. On July 17th, a leaky levee valve required pumping water away from homes just east of FM 1420 immediately north of the Levee Road near Santa Monica. ||Crops may have been destroyed by the flood along North Floodway, but damage in the Willacy County portion was unknown as of this writing. Infrastructure damage to roads and low water bridges may have exceeded [$x] thousand in southeastern Willacy County. |
| May 2009 | Thunderstorm Wind | Raymondville | $50,000 | A microburst from a cluster of thunderstorms moving through Raymondville toward Lyford rolled a new but unsecured mobile home just west of Raymondville. Nearby, several fences were blown down, and the door to an industrial building was blown in. Farther south, at about the same time, an amateur radio operator reported |estimated wind gusts of 50 mph or higher occurred just north of Lyford. |
| August 2005 | Tornado (F0) | Raymondville | $50,000 | no account filed |
| April 2023 | Thunderstorm Wind | Raymondville | $40,000 | Pictures from the Raymondville area of Willacy County showed damage from a line from south of HWY 186 and S 1st Street to a quarter mile north of the Raymondville Country Club along S 7th Street. Some of the pictures included a part of a wood roof peeled back from a porch on W Gem Street and some gate and metal roof damage to a garage along S 7th Street. There was also a video shared from the Holiday Inn Express near the intersection of US-77/I-69E and HWY 186 looking to the southwest showing a large gust front blowing through Raymondville in the areas mentioned above. A closer inspection of the video shows some debris lofted into the air and was used a guide for the estimated 70 mph wind gusts. The time is based on the video and radar. |
| April 2020 | Thunderstorm Wind | San Perlita | $30,000 | A mini-supercell thunderstorm rolled through central and southeastern Willacy County a little more than an hour after sunrise, and produced damaging winds near San Perlita and on nearby ranches around 830 AM CDT. One residence in San Perlita, fully exposed to the northwest, sustained significant damage when its poorly constructed roof lifted off. The residence was a mobile home with a separate addition on a pier/block foundation. Nearby damage was noted along an 5.28 mile stretch of State Highway 186, with more than a dozen wooden power poles broken, uprooted, or leaning. Nearly all of the broken poles showed notable rot at the breakpoint, and others were only anchored in shallow soil. In total, county Emergency Management mentioned a total of 26 poles were damaged. The survey revealed a range of estimated wind speeds from 61 to 70 mph. |
| August 2019 | Thunderstorm Wind | Raymondville | $25,000 | One roof was blown off a residence in Raymondville, and there were several calls to dispatch of trees and power poles down between Raymondville and Lyford. |
| October 2015 | Flash Flood | Sebastian | $25,000 | Heavy rainfall raised water levels once again across eastern Wiallcy County. High water of 1 to 3 feet covered many streets and surrounded more than a dozen buildings, especially in the San Perlita area. |
| October 2015 | Flood | Sebastian | $25,000 | Hazardous high water conditions continued through the end of the month for eastern Willacy County, where high water remained on roadways, across agricultural fields, and in and around residences and businesses. |
| June 2019 | Thunderstorm Wind | Yturria | $15,000 | The Emergency Management Coordinator for Willacy County reported damage to eight utility poles and 20 to 30 mesquite trees on the I-69E Frontage Road near the intersection with Conley Road, north of Raymondville. The utility pole damage was a combination of those uprooted from the ground and others broken in half. Bark was peeled from some of the mesquite trees. Damage width of poles and trees was about one-half mile long. In addition, grass of one and one-half foot tall was blown down in circular fashion in nearby locations. |
| July 2008 | Flash Flood | Sebastian | $14,250 | A little after noon on the 23rd, the first torrents of blinding rains from a flare-up of convection in the southern and western eyewall of Huricane Dolly began heading into southeastern Willacy County. These torrents, falling on top of already heavy rainfall earlier that morning, likely began producing high water levels, likely 3 feet or more, starting near Porfirio. Soon after the eyewall intensification, Dolly's center made landfall along the Cameron/Willacy County line, then very slowly edged west through central and southern Willacy County through the rest of the afternoon and evening, reaching the Hidalgo County line at around 9 PM CDT. ||Throughout the afternoon, blinding, torrential rains persisted over south central and eventually southwestern portions of the county, within the inner core of convection immediately west of the center of circulation. Flash flooding of increasingly high water - as high as 5 feet in some places - spread west into Raymondville, Lyford, Sebastian, and La Sara. Parts of Raymondville and Lyford were under differening levels of water during the afternoon and into the evening.||Measured and estimated rainfall totals in the flash flood areas of Willacy County from Dolly ranged from 12 to 18 inches, though there was one unconfirmed report of more than 20 inches along the Cameron/Willacy County line north of Rio Hondo. Dozens of homes likely sustained some level of inundation, and farmland was inundated across the flood zone as well. High water and general flooding would continue for another day or two, except much longer in backed up drainage areas.||Property damage data are based on reported, insured values from the FEMA National Flood Insurance Program. Actual values are likely significantly greater, due to the number of residences and businesses that flooded and were uninsured. Crop damage data is also estimated, and will be adjusted as more accurate data are received. Please note that damage values have been split between the flash flood period, and the more general flood event which followed. |
| July 2008 | Flood | Sebastian | $14,250 | The combination of 14 to 18 inches of rain, poor drainage issues, and the overarching fact that the flat, saturated landscape of the Lower Rio Grande River Delta drains very slowly, maintained widespread flood conditions well after the rains ended during the early morning of the 24th. Numerous roads and neighborhoods, particularly across southern Willacy County, remained flooded right through the weekend which followed Dolly's passage. In some areas, where ground drainage mechanisms were exceptionally poor, the flooding persisted into August. ||Some of these areas included neighborhoods in Raymondville, Lyford, La Sara, and Porfirio.||Property damage data are based on reported, insured values from the FEMA National Flood Insurance Program. Actual values are likely significantly greater, due to the number of residences and businesses that flooded and were uninsured. Crop damage data is also estimated, and will be adjusted as more accurate data are received. Please note that damage values have been split between the general flood event listed here, and the flash flood period which preceded it. |
| July 2021 | Flash Flood | Port Mansfield | $10,000 | A Co-Op Observer reported 5.8 inches of rain occurring between 10:30 AM and 2:00 PM, along with minor flooding in the Port Mansfield area. One house also experienced flooding. |
| June 2019 | Thunderstorm Wind | La Sara | $10,000 | Numerous large mesquite and a few large ash tree limbs, including some uprooted trees, were seen on an NWS Storm Survey in western Willacy County from State Highway 186 about 8 miles west of Raymondville through and just south of Lasara along FM-1015. A few power lines were also felled. Wind speed estimated from the damage indicators and radar estimates. |
| October 2015 | Heavy Rain | Raymondville | $10,000 | An estimated 2 to 4 inches of rain fell across Raymondville leading to nuisance and urban flooding that would later reach into a few businesses in town. |
| June 2011 | Heavy Rain | Raymondville | $10,000 | Slow moving thunderstorms, containing more than an hour of torrential rains, dumped between 3 and 6 inches in central Willacy County during the early and mid afternoon of June 22nd. In Raymondville, up to a foot of standing water was observed by storm spotters and the county Emergency Manager; several roads were temporarily closed due to the urban/poor drainage flooding. No water reached structures. Observed rainfall ranged from just under 3 inches on the west side of Raymondville to 6.10 inches 6 miles east of Raymondville (San Perlita). Other minor flooding was reported in Sebastian (just north of the Cameron/Willacy County line), with backyards turning to low water lakes and streets with more than a foot of water in them.||The flooding in Sebastian intensified on the 23rd, reaching into properties as poor drainage structure in town (pipe structure) could not handle the heavy rains and flooding reached into the ground floor of a number of structures in town. |
| April 1995 | Thunderstorm Wind | Santa Monica | $10,000 | Widespread wind and hail (0.50) damage to crops countywide with numerous roads and streets flooded. Rainfall totals of two to six inches were reported. Near Santa Monica, power poles were blown down, palm trees were topped, a barn was destroyed, and several autos were washed into a ditch. |
| April 1995 | Thunderstorm Wind | Countywide | $10,000 | Widespread wind and hail (0.50) damage to crops countywide with numerous roads and streets flooded. Rainfall totals of two to six inches were reported. Near Santa Monica, power poles were blown down, palm trees were topped, a barn was destroyed, and several autos were washed into a ditch. |
| May 2011 | Hail | Raymondville | $5,000 | A friend of an NWS employee reported Golfball size hail in Raymondville, some which caused dents and dings to several vehicles parked outside, as the first of two hailstorms scooted through Willacy County during the mid afternoon of May 15th, 2011. |
| June 2011 | Lightning | Raymondville | $5,000 | Frequent cloud to ground lightning, particularly on the 22nd, caught a 400 barrel oil container on fire in Willacy County, and effects of another strike injured a woman attempting to enter her vehicle, all occurring around 3 PM CDT. The container fire was put out by the torrential rains; the woman was admitted to Valley Baptist Medical Center for observation. |
| April 1999 | Tornado (F0) | Santa Monica | $5,000 | no account filed |
| June 2017 | Thunderstorm Wind | Lyford | $3,000 | A couple of utility poles were reported down along FM 491, approximately one mile west of Business 77. |
| September 2015 | Thunderstorm Wind | San Perlita | $3,000 | Willacy County Emergency Manager reported two power poles down and two power poles damaged along Highway 186 near the wind turbine farm west of San Perlita. |
| May 2010 | Thunderstorm Wind | Raymondville | $3,000 | Trees and large limbs were blown down on various streets in Raymondville. Time and duration are estimated by radar, based on core of estimated winds between 50 and 52 knots a few thousand feet above the surface. |
| September 1970 | Tornado (F1) | not stated | $2,500 | no account filed |
| September 2016 | Thunderstorm Wind | La Sara | $2,000 | Willacy County Emergency Manager reported a telephone pole blown down on FM 1015 in the town of Lasara and a power line down in Raymondville, near the intersection of TX 186 and Business 77. |
| May 2015 | Thunderstorm Wind | Raymondville | $2,000 | Willacy County EM reported a telephone pole blown down at 100 East Sunset Avenue in Raymondville and at the intersection of FM 1762 and Business 77 in Raymondville. Peak winds were estimated to be 45 mph. |
| August 2008 | Tornado (EF0) | Sebastian | $2,000 | Emergency management officials reported a brief touchdown of a small tornado in western Willacy County, likely between Sebastian and Lyford. The tornado produced some damage, but details were not known. |
| May 1999 | Thunderstorm Wind | Raymondville | $2,000 | Trees down. |
| November 2013 | Flash Flood | Raymondville | $1,000 | Slow moving thunderstorms dropped over three inches of rain over the Raymondville area in the matter of a few hours, with a nearby COOP site reporting 3.2 inches. This rainfall caused water to rise rapidly in downton Raymondville. The Willacy County emergency manager reported several inches of water entering the Raymondville City Hall building. |
| July 2008 | Heavy Rain | Raymondville | $1,000 | A number of roads in typically poor drainage locations of Raymondville sustained minor flooding, when persistent bands of torrential rains moved through the western half of Willacy County during the morning and early afternoon of July 7th. In general, rainfall between 2 and 3 inches fell during this time period, near the end of a weeklong welcome drenching that that dropped between 5 and 7 inches, perhaps higher in a few spots, across the more populated areas of the Lower Rio Grande Valley, stretching north and northwest toward the King Ranch (Kenedy County) and northeast Hidalgo County.| |Street flooding seeped into the the Raymondville City Hall, soaking some carpeting and forcing crews to sandbag the doorways. Other streets were blocked by Law Enforcement to prevent vehicles from pushing floodwaters into stores in poor drainage areas of downtown. As of this writing, no significant damage was reported.||The rains ended by mid afternoon on the 7th, and minor street flooding subsided. |
| September 1997 | Thunderstorm Wind | Lyford | $1,000 | Wind casued extensive tree damage. |
| June 2017 | Thunderstorm Wind | Raymondville | $500 | Large tree reported down via social media. Time estimated based on radar. |
| March 2026 | Tornado (EFU) | Lyford | - | KRGV Channel 5 news shared a video of a landspout tornado near East FM 1018, in the Lyford area. Location estimated from distance from where the video was taken. |
| April 2025 | Flood | Port Mansfield | - | Torrential rains fell in just a few hours across Port Mansfield between 9 AM and 1230 PM CST (10 AM and 130 PM CDT), with the cooperative observer (Harbormaster) reporting 6.83 during this time. While the town's generally decent drainage prevented a significant flood, there was minor street flooding reported in town (water of unknown depth) during the peak of the rainfall. |
| March 2025 | Flash Flood | Lyford | - | Torrential rainfall with estimated totals ranging from 6 to 12 inches affected southern/southwestern Willacy County during the mid to late evening of March 27, with several water rescues reported in Sebastian along the Cameron County line. Additional flooding with water depths on roads likely at or near 3 feet occurred northward to Lyford and perhaps the outskirts of Raymondville, and also east to FM 1420 between Santa Monica and Willamar. ||An unknown number of structures had some flooding. Countywide damage statistics will be available later in 2025. |
| March 2025 | Flood | Lyford | - | The Texas Department of Transportation continued to report flooding along the frontage road near Sebastian well into March 28th, with additional flooding noted by emergency management/law enforcement along Farm-to-Market and County roads in the southern portion of the county. Flooding continued at homes in the Sebastian area where drainage backups remained.||There was an unknown amount of water remaining in the North Floodway of the International Boundary and Water Commission's Flood Control Project. Further details for Willacy County flooding well after the rains ended will be provided through updates. |
| March 2024 | Hail | Raymondville | - | There were several videos and pictures sent to the local news media of nickel size hail. |
| March 2024 | Thunderstorm Wind | La Sara | - | A Willacy County Emergency Manager reported a power pole and lines down at 1425 N 490 in Raymondville. |
| April 2023 | Hail | Sebastian | - | Several reports from social media of ping pong ball to hen egg, or two inch, hail just south of the Lyford area to the Cameron/Willacy County line. |
| April 2023 | Hail | Sebastian | - | Multiple reports of 0.5 to 2.0 hail in the Sebastian area. |
| August 2023 | Tornado (EFU) | San Perlita | - | A member of the media shared video of a well defined landspout just north of TX-186 west of San Perlita around 2:50PM CDT on August 15th. The commenter said it lasted around 5 minutes. Radar was used to give a more precise location and time. Dust and dirt were clearly lifted into the air in the video around the landspout. No damage or injuries were observed or reported. |
| April 2021 | Hail | Raymondville | - | Law enforcement reported dime-sized hail in the city of Raymondville as thunderstorms moved through the area. Time frame is estimated. |
| April 2021 | Hail | Raymondville | - | The Willacy County Sheriff's Department reported hail up to the size of nickels in Raymondville as storms moved through the area. Time frame is estimated. |
| October 2021 | Flood | Yturria | - | TXDOT reports standing water on I-69E/US-77 near and north of the business 77 split roughly 4 miles north of Raymondville. |
| July 2020 | Flash Flood | Sebastian | - | A second round of rainfall dropped an estimated 2 to 3 inches of rain in about two hours on southwest Willacy County, from just west of Lyford/Sebastian to the Cameron County line to the south and the Hidalgo County line to the west. The additional rainfall exacerbated ongoing flooding in this area, leaving pockets of 1 to 3 feet of water in roads (Farm-to-Market and County) and ditches. Public assistance property damage is listed in the episode for Hurricane Hanna, as it was the trigger event for the continuation of the flooding. Crop damage (Cotton, other dryland crops) due to the heavy rain is listed in the episode for Hurricane Hanna. |
| July 2020 | Flood | Sebastian | - | High standing water due to a total of 7 to 10 inches of rainfall that fell directly from Hurricane/Tropical Storm Hanna from late on July 25th through early afternoon on July 26th continued to close roads and stand in neighborhoods, fields, and ditches through the end of July. An additional 2 to 3 inches fell during the late afternoon and early evening of July 27th from an unrelated tropical rain band, leaving total rainfall of 10 to 15 inches in the area.||A combination of the heavy rain with known drainage capacity issues in the form of pumps, pipes, and retention kept water levels ranging from one to three feet deep on several Farm-to-Market and County Roads in the southwest corner of Willacy County from near Sebastian to north of Lyford to the eastern Hidalgo County line. Fields saw similar water levels, and low lying neighborhoods had high water near homes, with spot-built farm homes seeing some water inside. ||Note: Public Assistance (which includes damage to roads and bridges) and Crop damage is listed on the Flash Flood event in southwestern Willacy County for brevity. Individual assistance and insured damage reported through the National Flood Insurance Program was estimated to be around $6 million for Willacy County. This information is also included in the flash flood entry, as mentioned above. |
Named settlements recorded in the Geographic Names Information System, each with the topographic sheets covering it. Villages, hamlets and abandoned places alike. Each is shown with the nearest named watercourse or landform and the survey quadrangle it falls on.
Lyford census division · 78569 · Raymondville quadrangle
9 sheets, 1953 to 1992
Raymondville census division · 78580 · Raymondville quadrangle
9 sheets, 1953 to 1992
Lyford census division · 78569 · Raymondville quadrangle
9 sheets, 1953 to 1992
San Perlita census division · 78598 · Near El Sauz Island · Port Mansfield quadrangle
11 sheets, 1952 to 1985
Raymondville census division · 78580 · Raymondville quadrangle
9 sheets, 1953 to 1992
Raymondville census division · 78580 · Raymondville quadrangle
9 sheets, 1953 to 1992
Raymondville census division · 78580 · Raymondville quadrangle
9 sheets, 1953 to 1992
San Perlita census division · 78590 · San Perlita North quadrangle
12 sheets, 1921 to 1985
Raymondville census division · 78580 · Yturria quadrangle
13 sheets, 1922 to 1985
Sebastian census division · 78569 · Santa Rosa quadrangle
13 sheets, 1929 to 1992